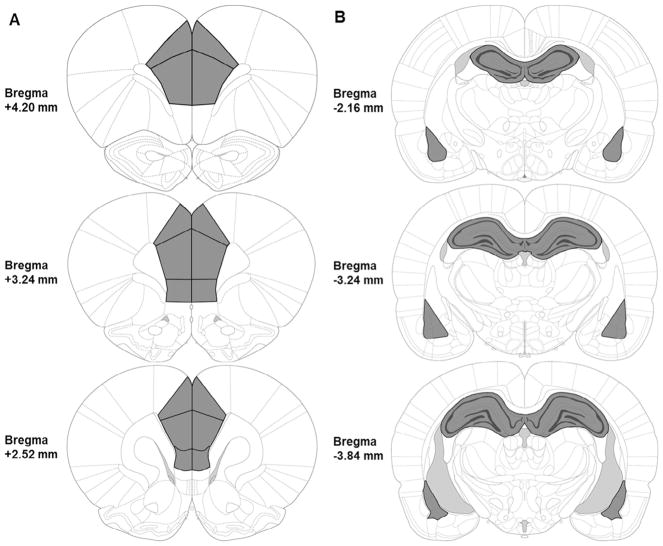
Fig. 2.
Illustration of brain regions analyzed (A, Left: mPFC; B, Right: dHPC and BLA) outlined in black and shaded in dark gray. mPFC tissues were collected between about +4.20 mm to +2.52 mm relative to bregma; dHPC and BLA complex tissues were collected between about −2.16 mm to −3.84 mm relative to bregma. Images are adapted from The Rat Brain in Stereotaxic Coordinates, 6th Ed (Paxinos & Watson, 2007).

