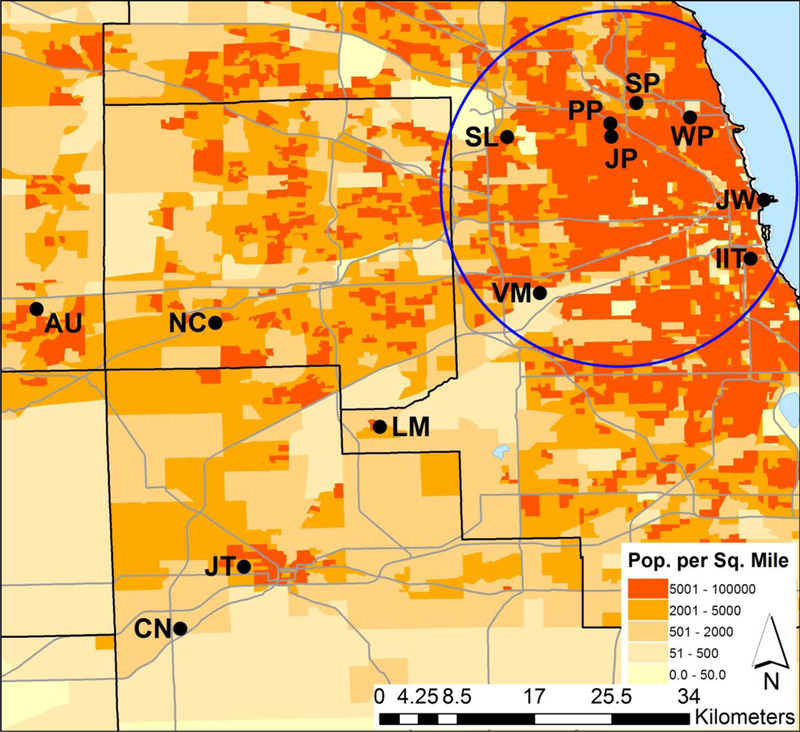
Figure 1:

Map of sampling sites around Chicago, Illinois. Sampling sites are labeled with a black dot and their identification code. Site abbreviations are given in Table S1. The black lines represent county boundaries with the largest being Cook County, and the gray lines represent major highways. The blue circle separates the “near” and “far” sites.
