Figure 3:

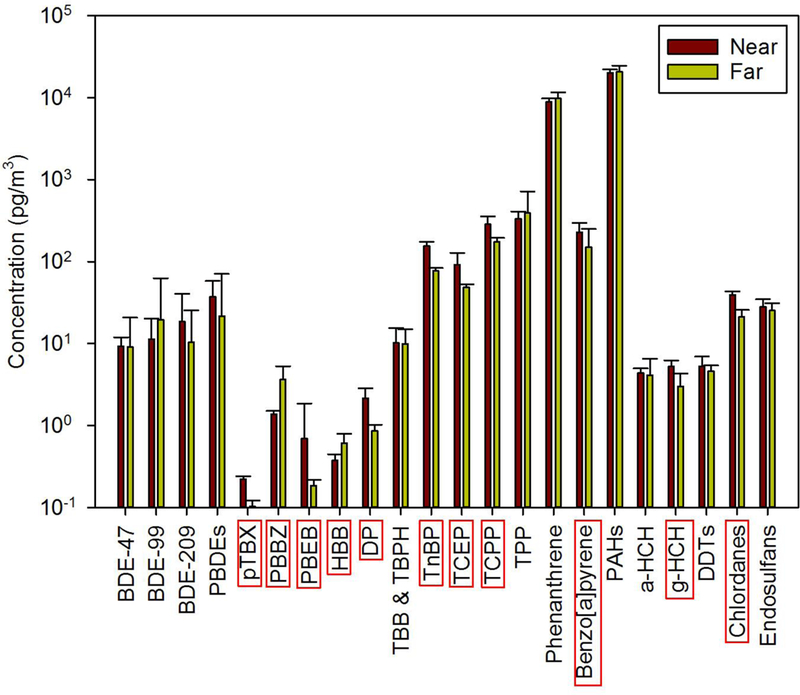
Geometric mean concentrations (pg/m3) of each compound grouped as “near” vs. “far” with standard error bars. Compounds with red boxes around their names showed significantly different (at P < 0.01) concentrations in the two regions.

Geometric mean concentrations (pg/m3) of each compound grouped as “near” vs. “far” with standard error bars. Compounds with red boxes around their names showed significantly different (at P < 0.01) concentrations in the two regions.