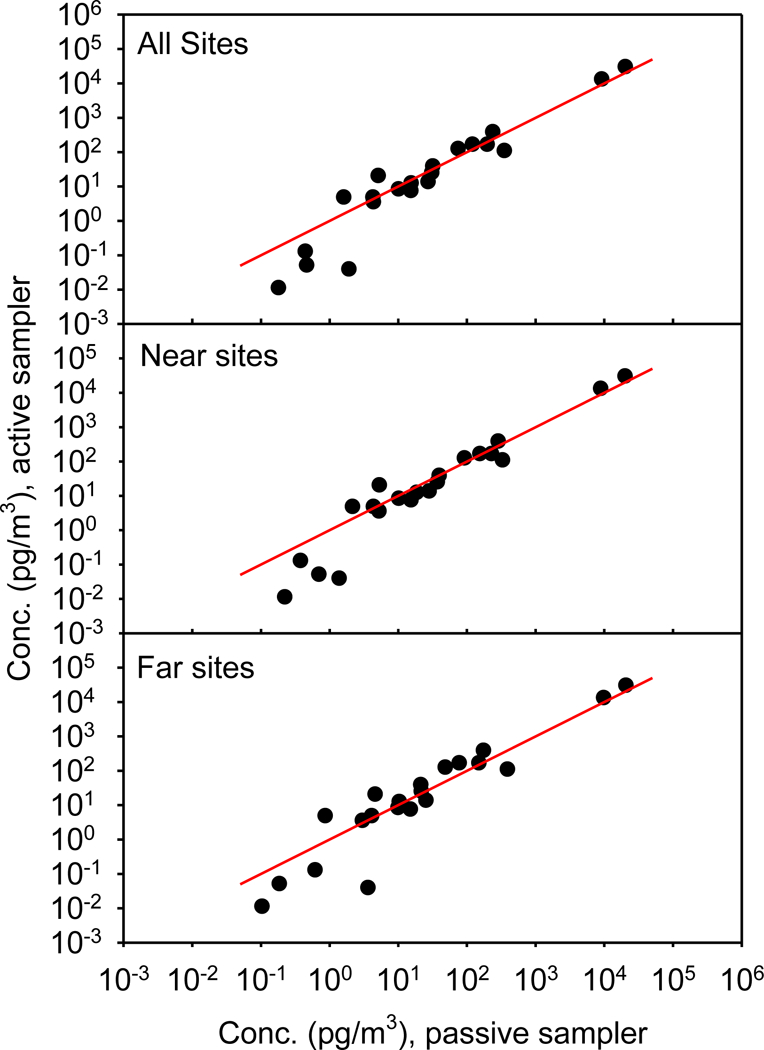
Figure 4:

Comparison of the average Chicago atmospheric concentrations measured in this study with a passive sampling system vs. those measured at the Illinois Institute of Technology (IIT) site with an active, hi-volume, sampling system. The red line has a slope of 1 and an intercept of 0. See Tables S4-S6 for the data.
