Figure 1.

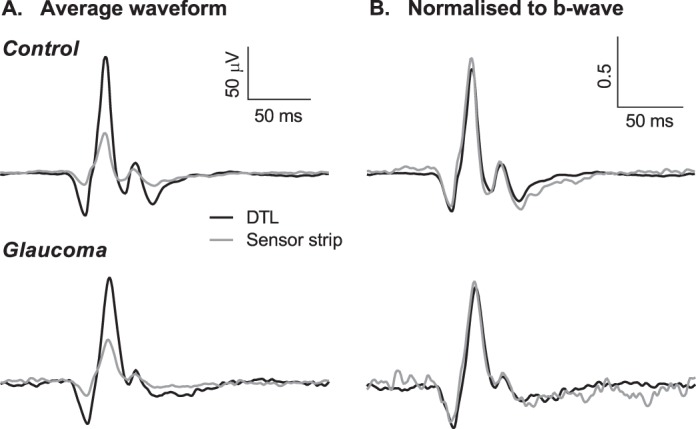
Average ERG waveforms in a control (top) and glaucoma (bottom) participant. (A) ERGs recorded with DTL (black) and sensor strip (gray) electrodes plotted on the same scale. (B) ERGs of both electrodes normalized to the respective b-wave amplitude.
