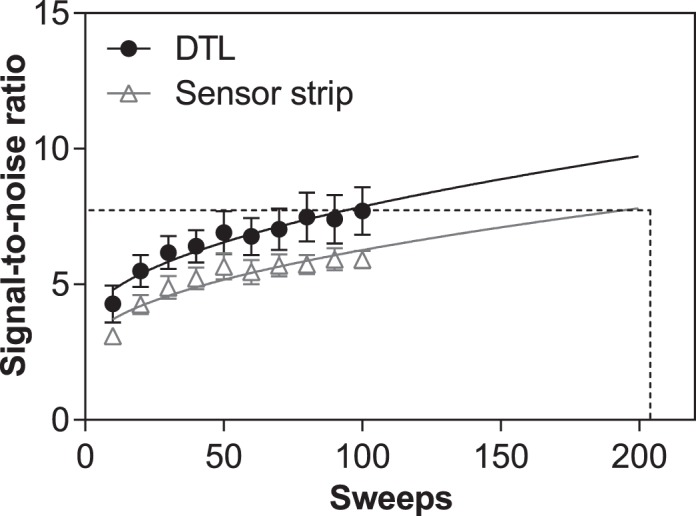
Figure 3.

Relationship between SNR and the number of sweeps for the DTL (black circles) and sensor strip electrode (gray triangles). A square root function was fitted over the points for each electrode (solid lines) to illustrate increasing SNR with increasing number of sweeps. Dashed lines represent the number of sweeps required with sensor strip electrode to achieve equivalent SNR as DTL at 100 sweeps, determined by extrapolating from the square root function. Values are mean and standard error.
