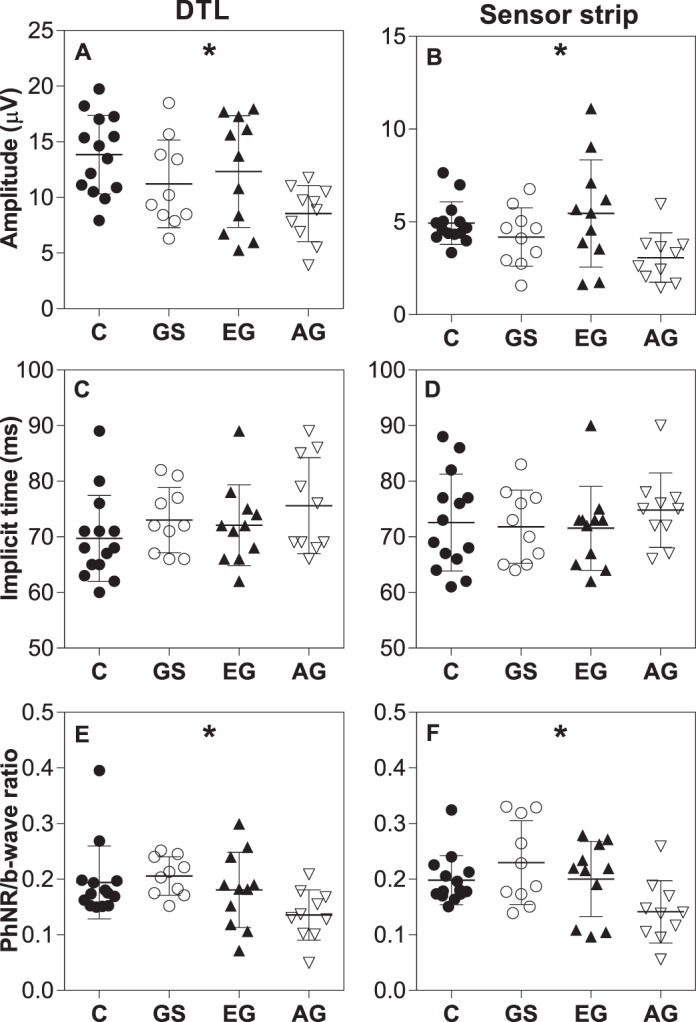
Figure 4.

Comparison of PhNR amplitude (A, B), implicit time (C, D), and ratio (E, F) recorded using DTL (left) and sensor strip (right) between control (age-matched), glaucoma suspects, and glaucoma participants divided according to VF MD. C, control; GS, glaucoma suspect; EG, early glaucoma (defined as MD > −6 dB); AG, advanced glaucoma (defined as MD ≤ −6 dB). Values are mean and SD. One-way ANOVA performed; *P < 0.05.
