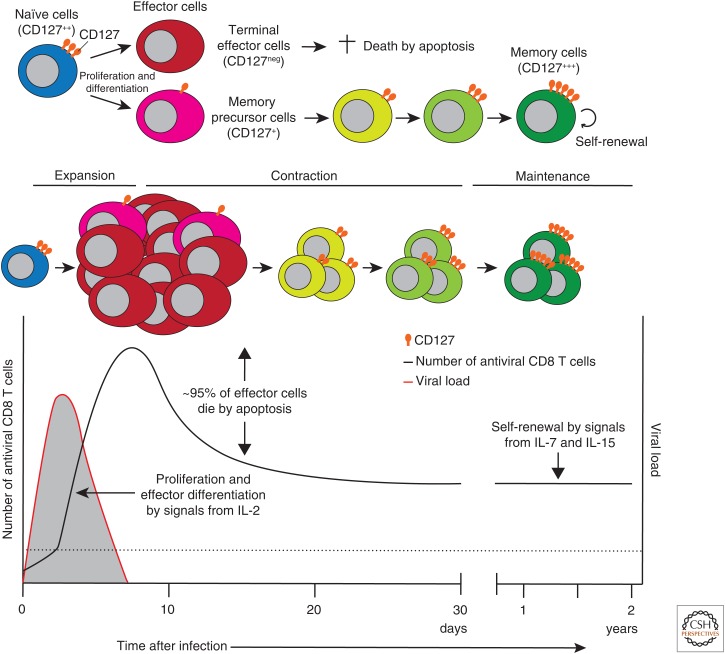
Figure 2.
Cytokine-mediated control of antiviral CD8 T-cell responses and their differentiation from naïve to effector to memory cells during acute infections. The black solid line indicates the dynamics of the number of antiviral CD8 T cells. The red solid line indicates the dynamics of the viral load. The dotted line indicates the limit of detection. Levels of CD127 expression on antiviral CD8 T cells at different stages of T-cell differentiation are shown. IL, Interleukin.

