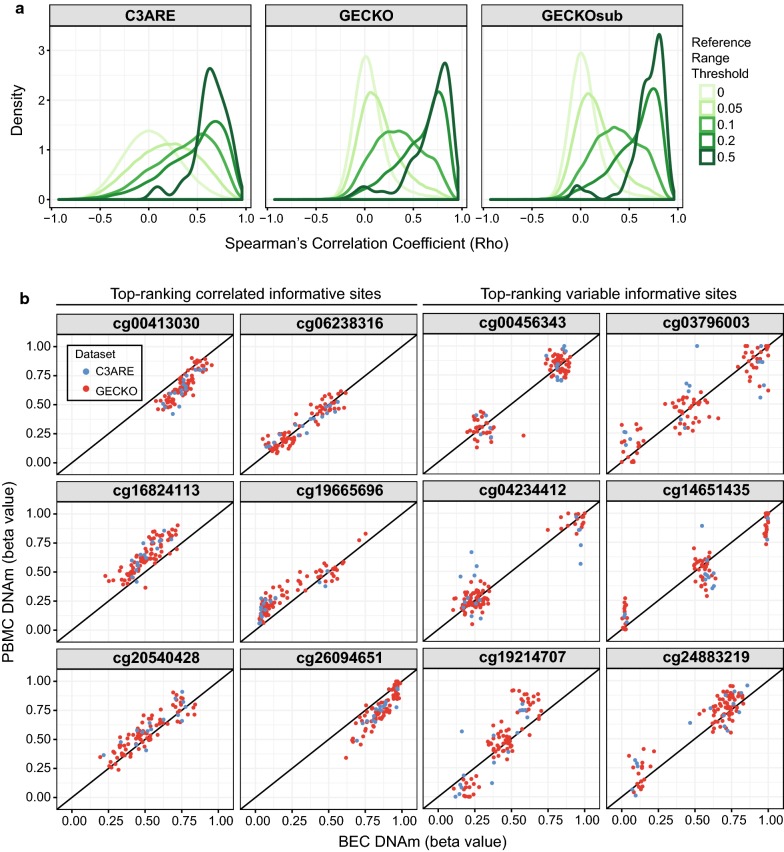
Fig. 2.
Variable CpGs were more highly correlated between tissues. a Density distribution plots of Spearman’s correlation rho between matched PBMCs and BECs across C3ARE, GECKO and GECKOsub datasets showing progressively greater enrichment of highly positively correlated CpGs at increasing reference range thresholds. Reference range thresholds were set along a sliding scale with cut-offs at 0, 0.05, 0.1, 0.2 and 0.5 (depicted by gradient of green lines). b Scatterplots of BEC DNAm versus PBMC DNAm for a representative set of informative sites (defined as CpGs that are both variable across individuals and highly correlated between BECs and PBMCs). Top-ranking correlated informative sites (shown in the left two columns) exhibited continuous distributions. In contrast, top-ranking variable informative sites (shown in the right two columns) exhibited discrete distributions, suggesting that these Cps may be under genetic influence. C3ARE samples are shown in blue while GECKO samples are shown in red

