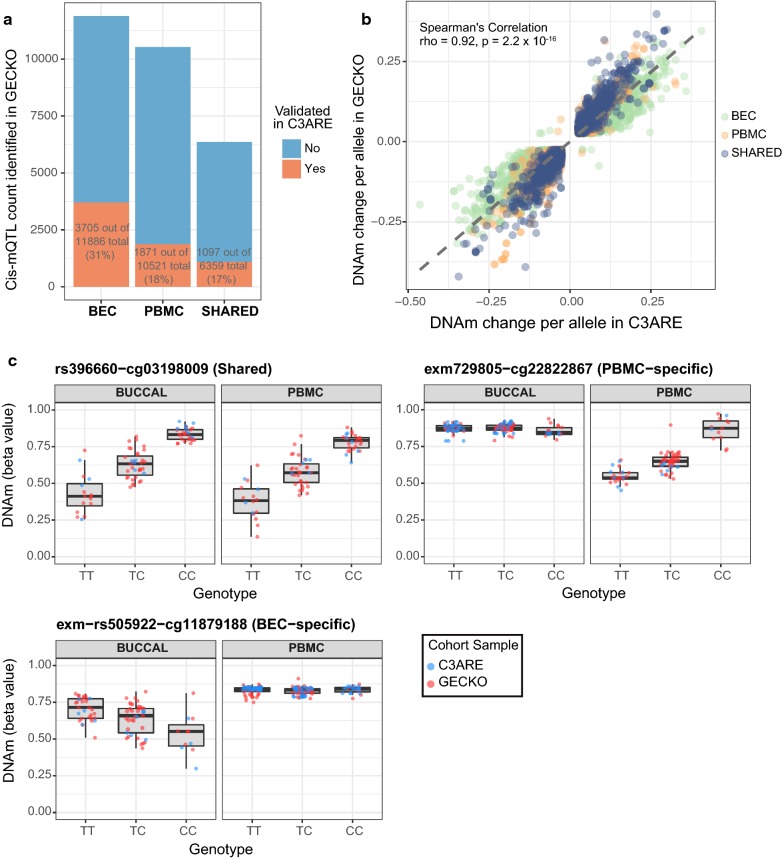
Fig. 3.
Independently validated cis-mQTL were more likely to be shared across tissues than expected by chance. a Stacked bar plot representing number of cis-mQTL identified in GECKO discovery cohort (shown in blue) and number of cis-mQTL validated in C3ARE cohort (shown in red) in either BECs, PBMCs or shared across both tissues. b Scatterplot of DNAm change per allele in GECKO versus C3ARE across all validated cis-mQTL shows mQTL effect sizes (measured as DNAm change per allele) were highly consistent across cohorts (BEC-specific, PBMC-specific and shared-tissue mQTL shown in different colors). c Boxplots of genotype versus DNAm for representative examples of a shared-tissued (top left), PBMC-specific (top right) and a BEC-specific (bottom) validated cis-mQTL. C3ARE samples are shown in blue while GECKO samples are shown in red

