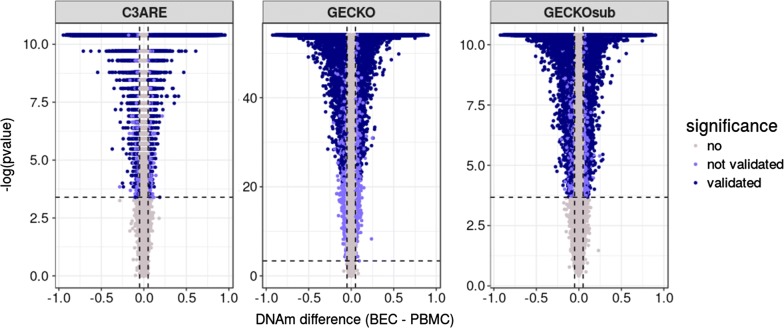
Fig. 4.
Tissue-specific differential DNA methylation was consistent across cohorts. Volcano plots of differential methylation analysis (run using a paired Wilcoxon signed-rank test) between BEC and PBMC tissues for C3ARE, GECKO and GECKOsub datasets. Vertical lines represent an effect size threshold of > 0.05 for absolute mean difference between tissues (BEC–PBMC) and the horizontal line represents the nominal p value corresponding to an FDR < 0.05 in each cohort. CpGs in dark purple met the effect size and significance cut-offs independently in all three datasets (139,662 CpGs). GECKO − log p values were ~ 5X greater than that of GECKOsub and C3ARE likely due to sample size differences between datasets (n = 79, n = 16, n = 16, respectively); y-axes were left unstandardized to display trends within each cohort

