Figure 11.
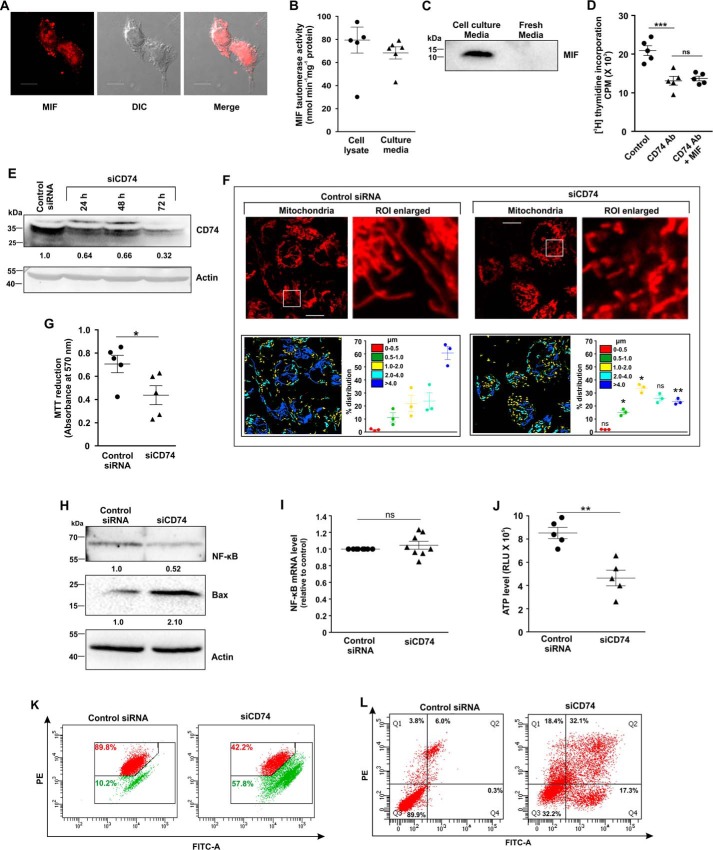
CD74-MIF signaling is necessary for AGS cell survival and maintenance of mitochondrial structural integrity. A, cellular expression and localization of MIF on cell surface in AGS cells by confocal immunofluorescence microscopy. MIF (red) was immunostained by anti-MIF primary and Alexa Fluor 647–conjugated goat anti-rabbit secondary antibodies; The third panel represents the merged differential interference contrast (DIC) image of cells with a red channel to demonstrate intracellular localization. Scale bar, 10 μm. B, MIF tautomerase activity to demonstrate intracellular production as well as secretion of MIF in AGS cells. C, immunoblot analysis of MIF in media obtained from AGS cell culture and unused fresh medium. D, [3H]thymidine incorporation assay in control, anti-CD74 antibody—treated, and anti-CD74 antibody + MIF–treated AGS cells. E, immunoblot analysis of CD74 in control siRNA- and siCD74-treated AGS cells harvested at the indicated time points to check the transfection efficiency. Actin was used as the loading control; numerical values corresponding to the densitometric analysis of the immunoblot data are provided below the bands. F, high-resolution confocal micrographs to demonstrate mitochondrial fragmentation in control siRNA- and siCD74-treated AGS cells. Scale bar, 10 μm. Enlarged images of the ROI were prepared by digital zooming of the selected region for clear visualization of mitochondria. Quantification of the mitochondrial length distribution of control and CD74-silenced cell by LAS-X software was documented for each set; 80–100 cells were screened for the analysis. The scatter plot in the lower right quadrant of each panel represents mitochondrial length distribution. Each color represents a specific filament length. G, cell viability test by MTT reduction assay in control siRNA- and siCD74-treated AGS cells. H, immunoblot analysis followed by densitometric assessment of NF-κB and Bax in control siRNA- and siCD74-treated AGS cells. Actin was used as endogenous control. Numerical values corresponding to the densitometric analysis of the immunoblot data are provided below the bands. I, gene expression analysis of NF-κB by real-time PCR in control siRNA- and siCD74-treated AGS cells by the 2−ΔΔCq method as elaborated under “Experimental procedures.” J, ATP content was evaluated in control siRNA- and siCD74-treated AGS cells with the help of a luciferase reaction–based technique, and RLU values are presented. K, flow cytometric analysis to follow mitochondrial transmembrane potential (ΔΨm) in control siRNA- and siCD74-treated AGS cells. The red signal in the scatter plot indicates JC-1 aggregates fluorescing at 590 nm, and green indicates JC-1 monomers (corresponding to depolarized mitochondria) fluorescing at 530 nm. Percentage values represent the number of cells emitting red or green signals and correspond to the cells with polarized or depolarized mitochondria. 10,000 events/experimental set were screened, and a representative flow cytometry scatter plot of the gated cell population is presented. L, flow cytometric analysis to determine the cell death in control siRNA- and siCD74-treated AGS cells with the help of FITC–annexin V/PI staining. 10,000 events were screened/experimental set, and a representative flow cytometry scatter plot of the gated cell population is presented. Quadrants Q2 and Q4 correspond to late and early apoptosis, respectively, and cumulatively represent annexin V binding to cells undergoing apoptosis. Percentages of cells are presented in each respective quadrant. The data presented are representative of three independent experiments. All experiments were done in triplicate. The details of each method are described under “Experimental procedures.” ns = nonsignificant; *, p < 0.05 and **, p < 0.01 versus control calculated by unpaired Student's t test. ns = nonsignificant with respect to anti-CD74 treatment; ***, p < 0.001 versus control, calculated by ANOVA followed by Bonferroni's post hoc test.

