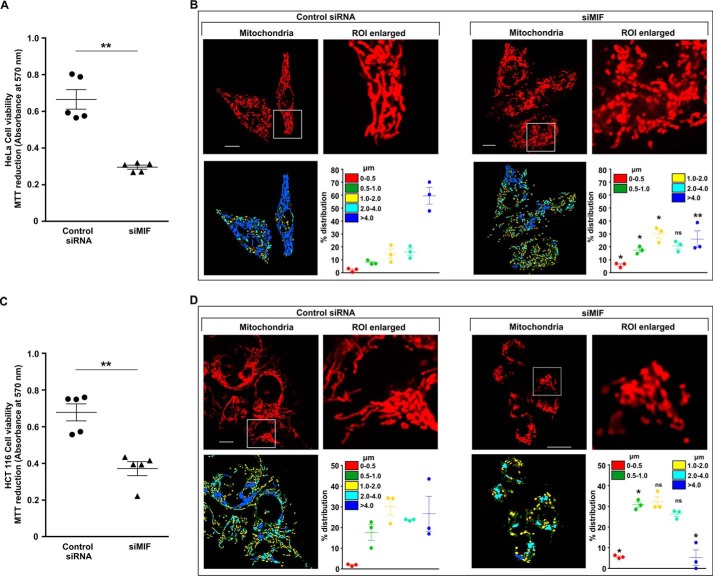
Figure 4.
Reduced viability because of MIF knockdown is positively associated with elevated mitochondrial fission in HeLa and HCT116 cells. A, cell viability test by MTT reduction assay in control siRNA- and siMIF-treated HeLa cells. B, high-resolution confocal micrographs to demonstrate mitochondrial fragmentation in control siRNA- and siMIF-treated HeLa cells. Scale bar, 10 μm. C, cell viability test by MTT reduction assay in control siRNA- and siMIF-treated HCT116 cells. D, high-resolution confocal micrographs to demonstrate mitochondrial fragmentation in HCT control siRNA- and siMIF-treated HCT116 cells. Scale bar, 10 μm. 80–100 cells were randomly screened and subjected to analysis; a single cell was randomly selected to demonstrate mitochondrial fission at the single-cell level. Enlarged images of the ROI were prepared by digital zooming of the selected region for clear visualization of mitochondrial filaments. Quantification of the mitochondrial length distribution of control and MIF-silenced cell by LAS-X software is provided beneath each set. The scatter graph adjacent to each micrograph represents mitochondrial length distribution. Each color represents a specific filament length as indicated in the inset of the scatter plot. The details of each method are given under “Experimental procedures.” ns = nonsignificant; *, p < 0.05; **, p < 0.01 versus control, calculated by unpaired Student's t test.

