Figure 7.
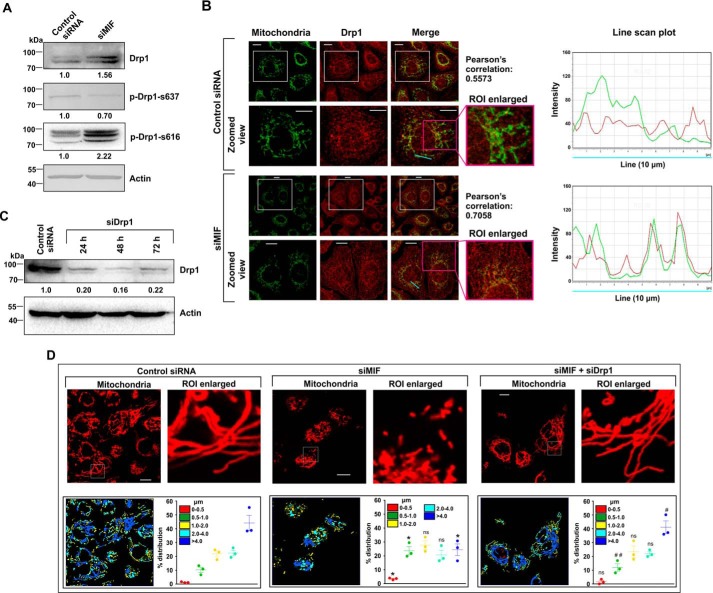
Effect of MIF knockdown on the expression of key proteins modulating mitochondrial fission in AGS cells. A, Western blot analysis to follow the expression of fission regulator Drp1, phosphorylated Drp1, i.e. p-Drp1-s637 and p-Drp1-s637, in control siRNA- and siMIF-treated cells. Actin was used as the loading control. Numerical values corresponding to the densitometric analysis of the immunoblot data are provided below the bands. B, left panel, confocal micrographs to demonstrate Drp1 translocation to mitochondria in control siRNA- and siMIF-treated cells. The second and fourth columns represent zoomed views of the corresponding fields presented in the first and third columns, respectively. The third column represents the merged image, whereas the fourth column represents the enlarged view of the selected ROI, along with the Pearson's correlation coefficient quantifying the distribution of Drp1 on mitochondria. Scale bar, 10 μm. The right panel represents the line scan plot of the cyan line presented in the Merge panel. C, immunoblot analysis of Drp1 to check the transfection efficiency in control siRNA- and siDrp1-treated cells harvested at the indicated time points. Actin was used as the loading control. Densitometric analyses of the immunoblot data are presented below the bands. D, high-resolution confocal micrographs to demonstrate mitochondrial fragmentation in control siRNA, siMIF, and siMIF + siDrp1 double-transfected AGS cells. Scale bar, 10 μm. 80–100 cells were screened randomly, and a single cell was randomly selected to demonstrate mitochondrial fission at the single-cell level. Enlarged images of the ROI were prepared by digital zooming of the selected region for clear visualization of mitochondrial filaments. Quantification of the mitochondrial length distribution by LAS-X software is provided along with each set. 80–100 cells were screened for this analysis. The scatter plots adjacent to each micrograph represent mitochondrial length distribution. Each color represents a specific filament length. The details of each method are given under “Experimental procedures.” ns = nonsignificant; *, p < 0.05 versus control; #, p < 0.05 and ##, p < 0.01 versus siMIF treatment calculated by ANOVA followed by Bonferroni's post hoc test.

