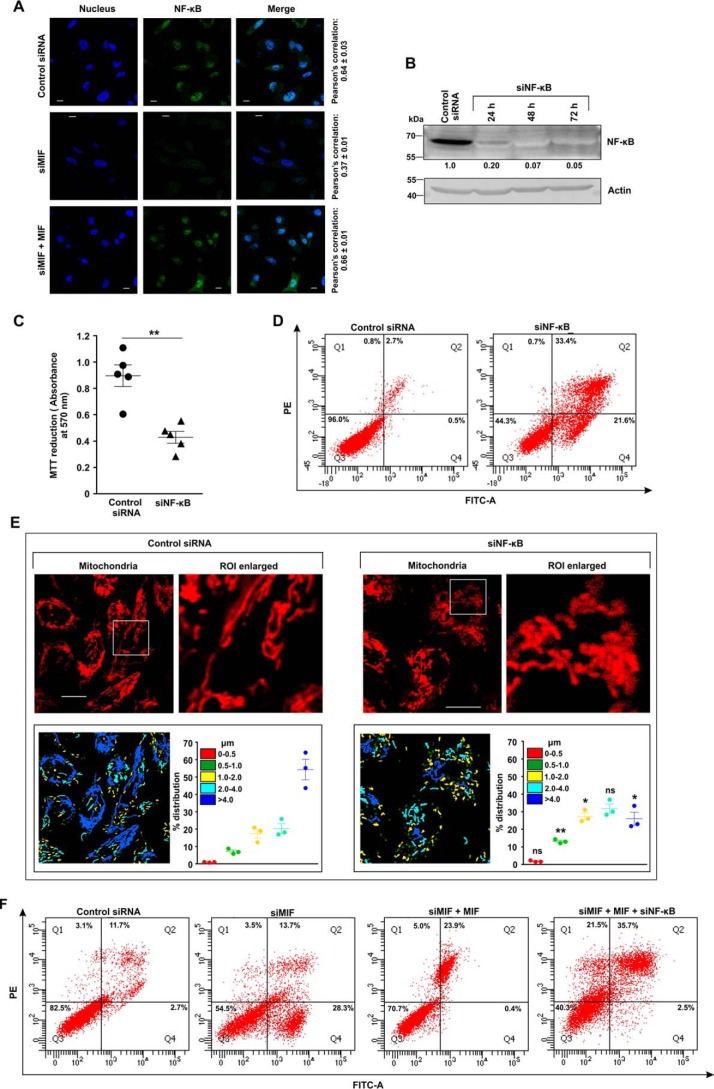
Figure 9.
MIF regulates the activation of NF-κB in AGS cells, which is instrumental in maintaining mitochondrial dynamic balance. A, confocal super-resolution immunofluorescent micrographs demonstrate nuclear translocation of NF-κB in control siRNA-, siMIF-, and siMIF + MIF–treated AGS cells. NF-κB (green) was immunostained by anti-NF-κB (p65) primary and Alexa Fluor 488–conjugated goat anti-rabbit secondary antibodies. Nuclei (blue) were stained with 4′,6-diamidino-2-phenylindole. The third column represents the merged images of NF-κB and nucleus. Pearson's correlation coefficient, used to quantify the distribution of NF-κB within the nucleus, is presented adjacent to each row. Scale bar, 10 μm. The image presented is representative of one of three independent experiments; about 100 cells/experimental set were screened for the analysis. B, Western blot analysis of NF-κB in control siRNA- and siNF-κB–treated AGS cells harvested at the indicated time points to check the transfection efficiency. Actin was used as the loading control. Numerical values corresponding to the densitometric analysis of the immunoblot data are provided below the bands. C, cell viability test by MTT reduction assay in control siRNA- and siNF-κB–treated AGS cells. D, flow cytometric analysis of control siRNA- and siNF-κB–treated AGS cells to determine the cell death by FITC–annexin V/PI staining. 10,000 events were screened/experimental set, and a representative flow cytometry scatter plot of the gated cell population is presented. Quadrants Q2 and Q4 correspond to late and early apoptosis, respectively, and cumulatively represent annexin V binding to cells undergoing apoptosis. Percentages of cells are presented in each respective quadrant. The data presented are representative of three independent experiments. E, live cell confocal micrographs demonstrate mitochondrial fragmentation in control siRNA- and siNF-κB–treated AGS cells. Scale bar, 10 μm. 80–100 cells were screened randomly, and a single cell was randomly selected to demonstrate mitochondrial fission at the single-cell level. Enlarged images of the ROI were prepared by digital zooming of the elected region for clear visualization of mitochondrial filaments. Quantification of the mitochondrial length distribution of control and NF-κB–silenced cells by LAS-X software are provided along with each set. The scatter plot graph in the lower right quadrant of each panel represents mitochondrial length distribution. Each color represents a specific filament length. F, flow cytometric analysis of control siRNA-, siMIF, siMIF + MIF-, and siMIF + MIF + siNF-κB–treated AGS cells to determine the contributing action of NF-κB knockdown in MIF-depleted AGS cells supplemented with recombinant MIF on cell death by apoptosis. 10,000 events/experimental set were screened, and a representative flow cytometry scatter plot of the gated cell population is presented. Quadrants Q2 and Q4 correspond to late and early apoptosis, respectively, and cumulatively represent annexin V binding to cells undergoing apoptosis. Percentages of cells are presented in each respective quadrant. The data presented are representative of three independent experiments. All experiments were done in triplicate. The details of each method are given under “Experimental procedures.” PE, phycoerythrin. ns = nonsignificant; *, p < 0.05 and **, p < 0.01 versus control calculated by unpaired Student's t test.

