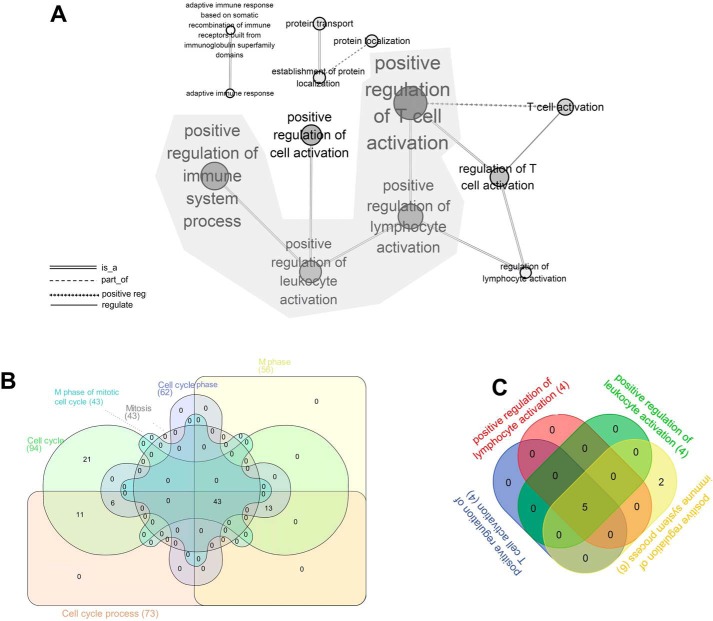
Figure 3.
GO tree analysis of the black gene module and Venn analysis of the essential GO terms. A, GO tree analysis of the black module showed correlations among GO terms associated with immune cell activation. B and C, Venn analysis of the essential GO terms that were associated with cell cycle and T-cell activation. (The degree of the color indicates the significance of each GO term, and the size of the node shows the interactions with the surrounding nodes.)

