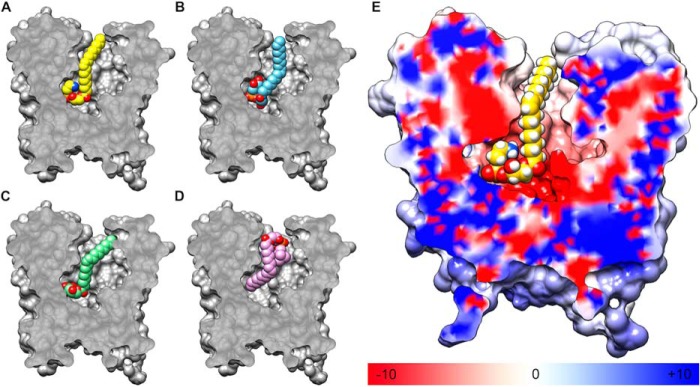
Figure 5.
A–D, sliced section of surface representation showing the orientations of the most favorable docked conformations of (A) 18:1 LPE, (B) 18:1 LPG, (C) 18:1 LPA, and (D) 18:1 LPC within the central cavity of the LplTKp model. E, sliced section of the electrostatic potential surface of LplTKp calculated by the APBS program (40). Regions having positive (blue) and negative (red) potentials surround the negatively-charged phosphate group and positively-charged ethanolamine head group, respectively, whereas neutral (white) regions surround the acyl tail.

