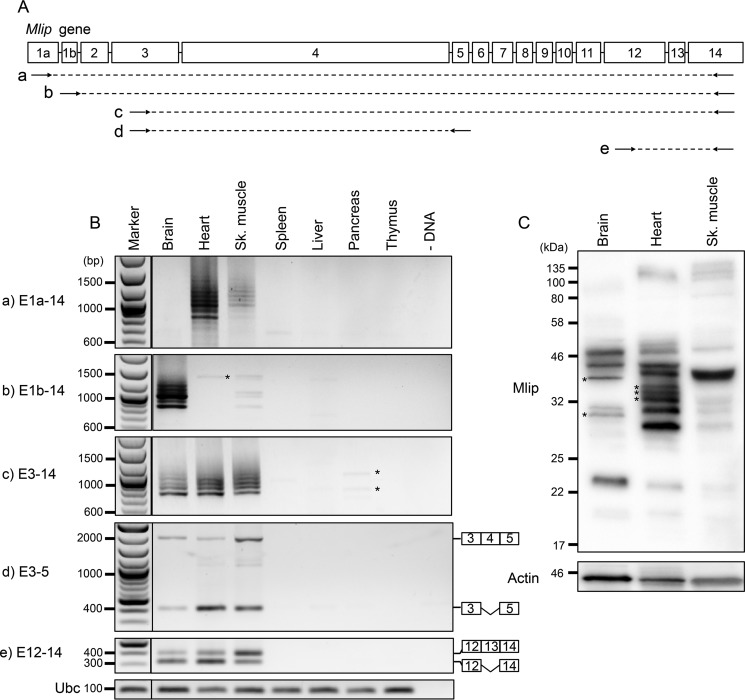
Figure 3.
MLIP tissue expression profile in Mlip+/+ mice. A and B, PCR amplification of Mlip cDNA on tissues of Mlip+/+ mice using different combinations of primers (arrows; A, a–e) targeting exons of the Mlip gene. *, nonspecific amplification. Ubc was used as a loading control. C, Western blot with MLIP antibody of MLIP+/+ brain, heart, and skeletal (Sk.) muscle. *, tissue-specific isoforms. Actin was used as a loading control.

