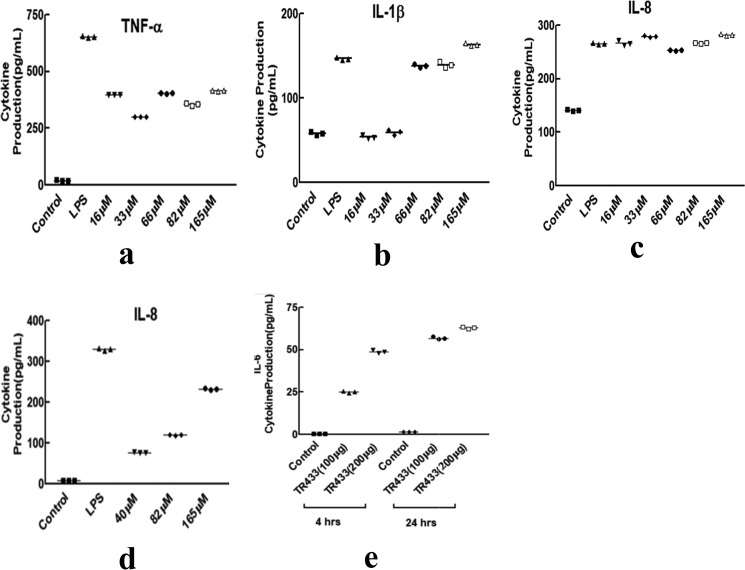
Figure 2.
Pro-inflammatory cytokine production. a–c, production of TNFα (a), IL-1β (b), and IL-8 (c) at different concentrations of TR-433 in THP-1 cells. Each data point is an average of three independent experiments (n = 3) performed in duplicates, and results are given as mean ± S.D. (error bars). d, IL-8 production in transfected HEK293T cells at different concentrations of TR-433. e, 100 and 200 μg of TR-433 was injected in mice (intravenously), and sera were collected after 4 and 24 h. IL-6 was quantified by ELISA. Each data point is an average of three independent experiments performed in duplicates.

