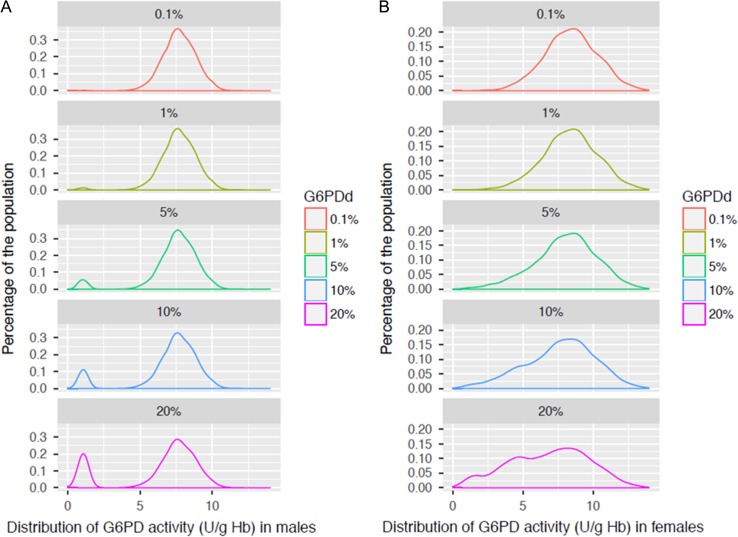
Figure 2.
Population distribution for males and females arranged by individual G6PD activity level (U/g Hb) at different G6PD-deficient allele frequencies in males. The distributions were modeled based on the Hardy–Weinberg equilibrium and using empirical data from a cross-sectional G6PD study, whereby G6PD activity was measured by the Trinity quantitative test (G-6-PDH 35-A).46 Population distributions are shown for (A) males and (B) females. These distributions were used for Table 2.

