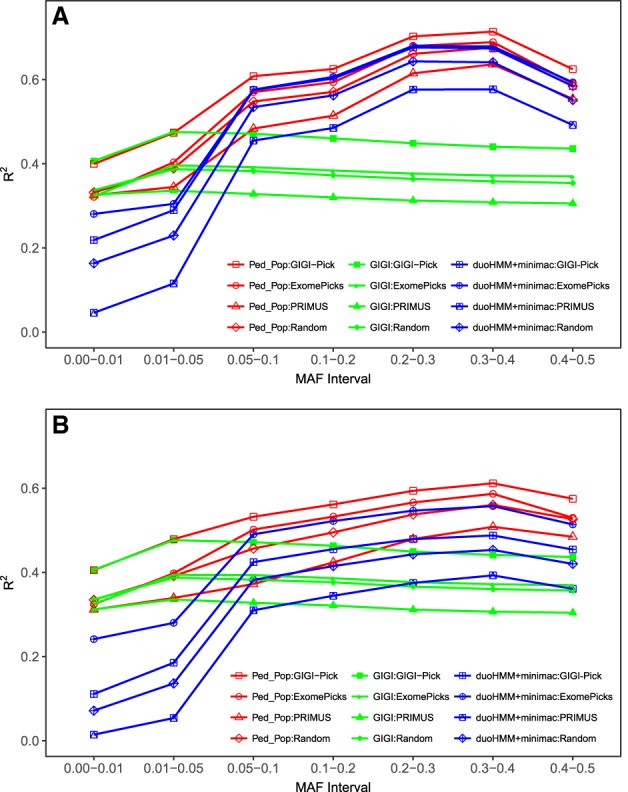
Figure 3.

Mean correlation R2 between true and imputed genotypes for the four selection strategies (GIGI-Pick, ExomePicks, PRIMUS, and random selection) for Ped_Pop, GIGI, and duoHMM+minimac: (A) EUR; (B) AFR. Computation of the mean of R2 is based on all 100 genetic data sets with a sample size of 960 subjects, each having 7954 SNPs for EUR and 10,891 SNPs for AFR.
