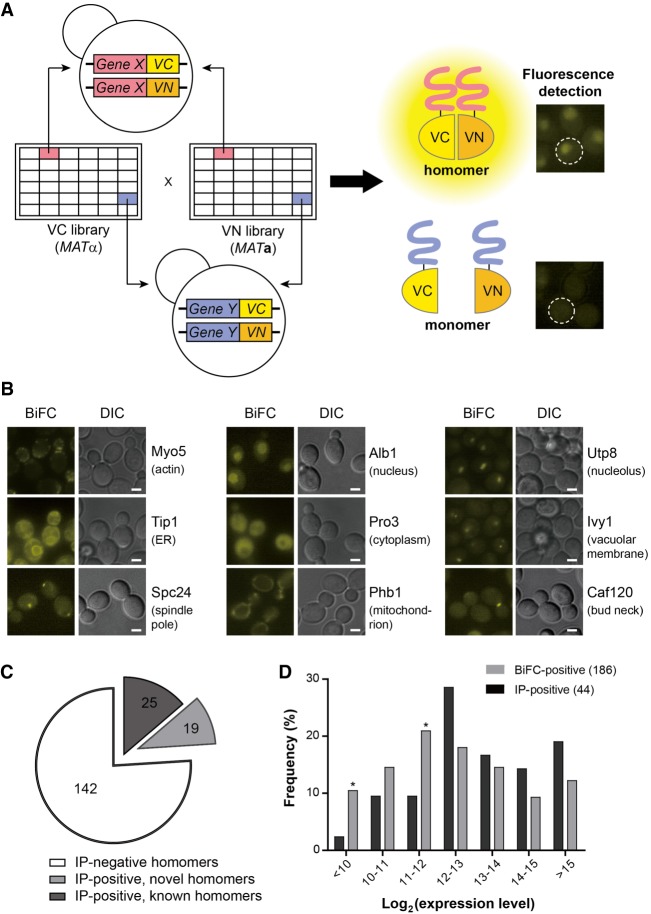
Figure 2.
Genome-wide screen for protein homomers using the MATα VC fusion library and the MATa VN fusion library. (A) Scheme of the genome-wide BiFC analysis of protein homomers. Each strain in the MATα VC fusion library was mated with its cognate strain in the MATa VN fusion library. The resulting diploid cells expressing both the VC and VN fusion proteins were analyzed by fluorescence microscopy. (B) Representative BiFC images of homomer candidates with diverse subcellular localizations (Huh et al. 2003). The names of proteins and their localizations are designated on the right of each image. Scale bars, 2 µm. (C) Venn diagram depicting the numbers of homomer candidates detected by Co-IP and the BiFC assay. For detailed data from the Co-IP assay, see Supplemental Figure S2. (D) Bar graph depicting the comparison of the expression levels of homomer candidates detected by Co-IP (black bars) and the BiFC assay (gray bars). The expression level of each protein was obtained from the Yeast GFP Fusion Localization Database (https://yeastgfp.yeastgenome.org). Asterisks indicate significant enrichment in BiFC compared with Co-IP (P < 0.05; hypergeometric test).

