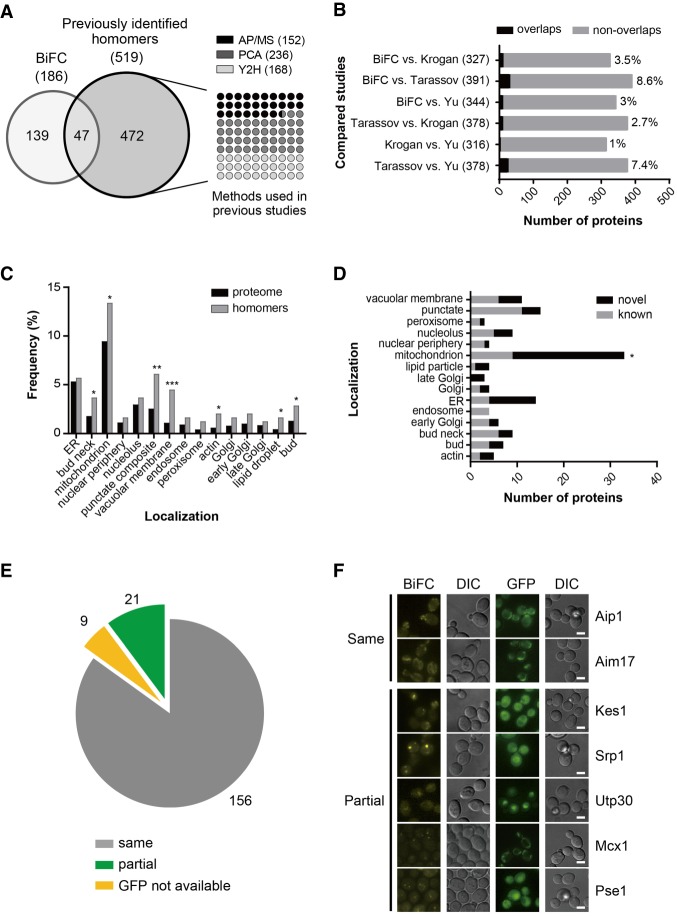
Figure 3.
Characterization of protein homomer candidates. (A, left) Venn diagram depicting the comparison of homomer candidates identified in this study and those identified in three previous analyses. (Right) Analysis methods used in previous studies and the number of homomer candidates detected by each method. AP/MS, PCA, and Y2H represent affinity purification–mass spectrometry (Krogan et al. 2006), the protein complementation assay (Tarassov et al. 2008), and the yeast two-hybrid assay (Yu et al. 2008), respectively. (B) Bar graph depicting the comparison between the data set in this study and each of the three previous data sets. Black and gray bars indicate the number of homomer candidates that overlap and do not overlap, respectively. The percentage of concordance between data sets is indicated on the right of the bars. Numbers in parentheses indicate the total number of homomer candidates identified in two studies. (C) Subcellular localization of homomer candidates identified in this study. Black bars indicate whole proteins for which subcellular localization has been annotated in the Yeast GFP Fusion Localization Database (https://yeastgfp.yeastgenome.org), and gray bars represent homomer candidates identified in this study. Asterisks indicate significant differences compared with the proteome (Fisher's exact test): (*) P < 0.05; (**) P < 0.01; (***) P < 0.001. (D) Localization distribution of known and novel homomers. Gray and black bars indicate the number of known and novel homomers, respectively. Asterisks indicate significant differences compared with known homomers (Fisher's exact test): (*) P < 0.05. (E) Venn diagram depicting the comparison between the BiFC signal and the GFP signal of each homomer candidate. Proteins with identical BiFC and GFP signal patterns are shown as a gray pie slice. Proteins showing the BiFC signal as foci or partially localized within the GFP signal are indicated as a green pie slice. Proteins for which subcellular localization has not been annotated in the Yeast GFP Fusion Localization Database are shown as a yellow pie slice. (F) Representative fluorescence images of proteins showing the same or partial localization between the BiFC and GFP signals. Scale bars, 2 µm.

