Figure 1.
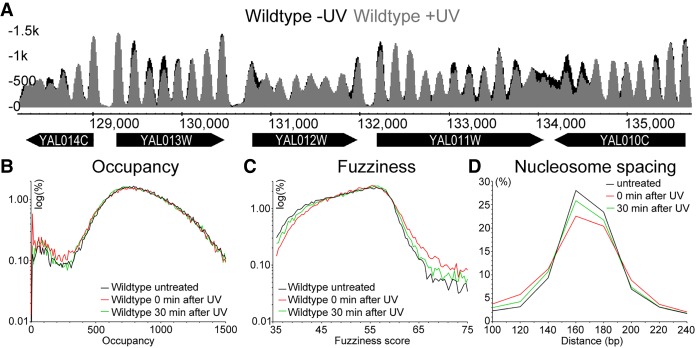
UV-induced changes to the genome-wide nucleosome landscape. (A) Represented here are the nucleosome traces of wild-type cells before (black) and after UV irradiation (gray) in an 8-kbp region on Chromosome I (128,000–136,000). The genes and their systematic names are indicated by the black arrows underneath the traces. The y-axis on the left indicates the relative read-counts that define the nucleosome peaks in this region. (B) Genome-wide changes to wild-type nucleosome occupancy (peak height) in response to UV irradiation are quantified here. The distribution of relative occupancy (in reads) of all the more than 60,000 nucleosomes as a log-scale of percentage is shown here. (C) As B but now quantifying the degree of freedom a nucleosome has to occupy its unitary position, expressed as fuzziness of all nucleosomes in response to UV irradiation. (D) As B and C, but now quantifying the change in the distribution of nucleosome spacing, reflecting the position of nucleosomes in the linear genome, expressed in base pairs for all nucleosomes after UV irradiation.

