Figure 2.
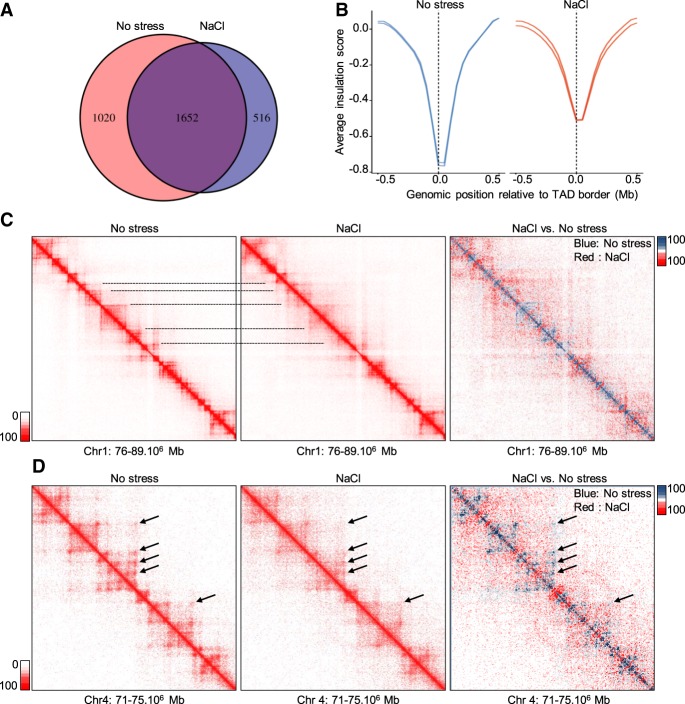
Stress causes a decrease in the number of TADs and in their insulation. (A) Overlap of consensus TAD borders for nonstressed and NaCl-treated cells obtained using TADbit. Consensus borders were defined by allowing a shift of one bin (50 kb) in each direction between the two biological replicates. Similarly, TAD borders were overlapped, allowing a 50-kb shift in each direction. (B) The insulation score in a window of 1 Mb around consensus TAD borders in nonstressed and NaCl-treated cells (50-kb resolution). (C) Example of a Hi-C interaction matrix from a region of Chromosome 1 (Chr 1) (20-kb resolution) in unstressed and NaCl-treated cells and following subtraction of the signal under both conditions. Blue indicates higher signal in control; red, higher signal in stress conditions. Lines indicate different TADs. (D) Example of a Hi-C interaction matrix from a region of Chromosome 4 (Chr 4; 10-kb resolution) in unstressed and NaCl-treated cells and following subtraction of the signals (as above). Arrows indicate loops.

