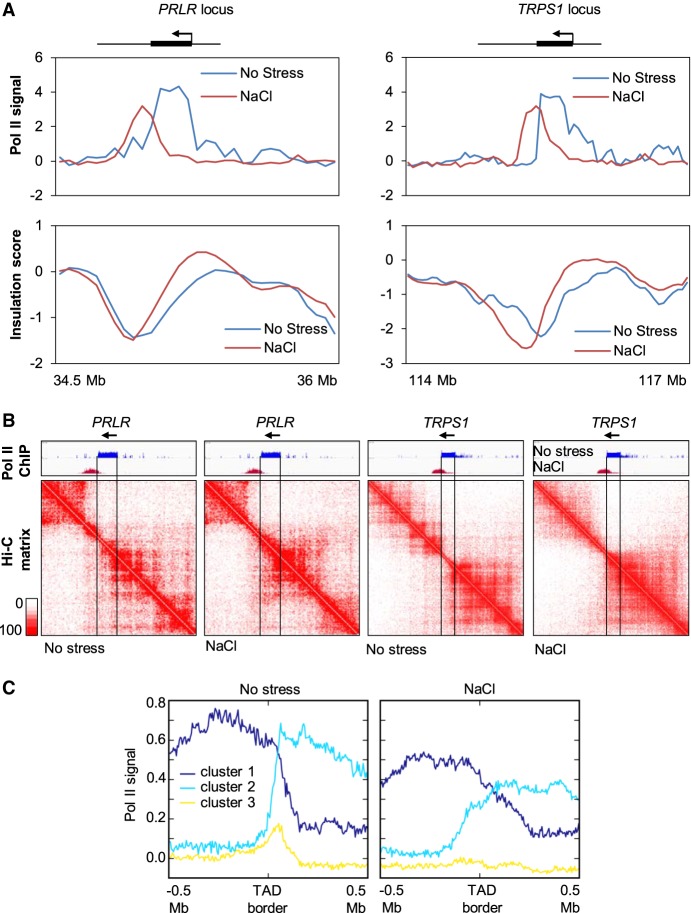
Figure 4.
Pol II read-through coincides with local contact map changes. (A) The Pol II ChIP-seq signal and the insulation score around PRLR and TRPS1 loci in nonstressed and NaCl-treated cells. (B) Hi-C contact maps of the PRLR and TRPS1 loci under both conditions (10-kb resolution). (C) Profiles of Pol II occupation of consensus TAD borders in nonstressed and NaCl-treated cells. The TAD borders were defined under nonstress conditions (allowing a 50-kb shift between replicates). Binding profiles were clustered using k-means and signals of 500 kb upstream of or downstream from each TAD border. Genomic loci and clustering are independent of Figure 3C.

