Figure 5.
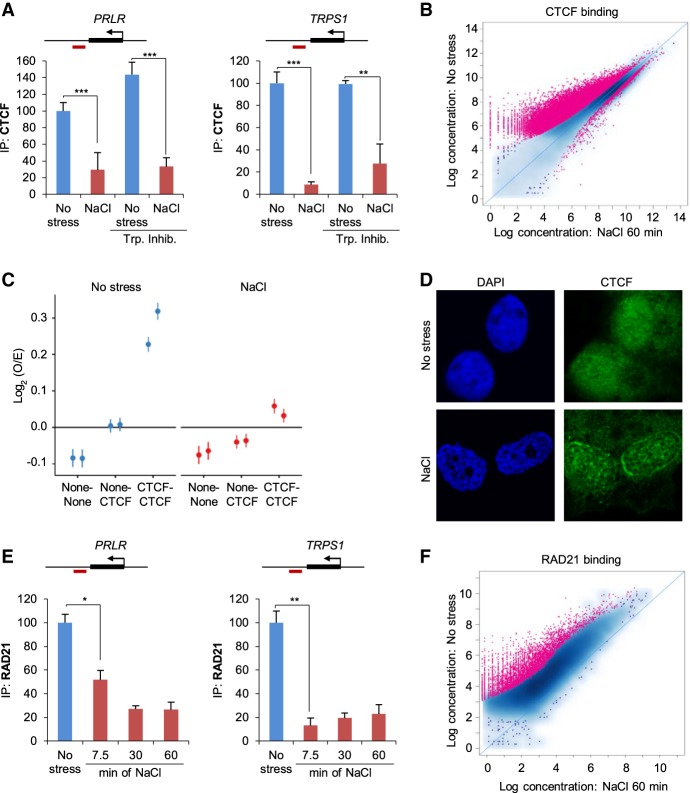
Architectural proteins are displaced from their normal chromatin binding sites after osmostress. (A) ChIP analysis of CTCF binding at previously described CTCF sites (Le Dily et al. 2014) in PRLR and TRPS1 loci in unstressed or 1-h NaCl–treated samples. Red boxes indicate amplified regions in the qPCR. When indicated (Trp. Inhib), a transcription inhibitor (200 nM flavopiridol) was added 2 h prior to stress (SEM of N = 3). (**) P < 0.005; (***) P < 0.0005; Student's t-test. (B) Global CTCF binding assessed by ChIP-seq, comparing control with 60-min NaCl treatment. Each dot represents one peak. A red color indicates a significant change (19,845 peaks, FDR < 0.05). (C) Aggregate short-range Hi-C signal (<2 Mb) between pairs of random genomic sites (none-none), between one CTCF and one random site (none-CTCF), or between pairs of CTCF sites (CTCF-CTCF) in unstressed and NaCl-treated samples. (D) Representative immunofluorescence images of no stress or 1-h NaCl–treated cells for CTCF and stained with DAPI. (E) ChIP-qPCR analysis of RAD21 binding at the indicated CTCF sites (red boxes indicate amplified region in the qPCR) in control cells or at the indicated times (minutes) of NaCl treatment (SEM of N = 3). (*) P < 0.05; (**) P < 0.005; Student's t-test. (F) Global RAD21 binding assessed by ChIP-seq, comparing control with 60-min NaCl treatment. Each dot represents one peak. A red color indicates a significant change (4536 peaks, FDR < 0.05).

