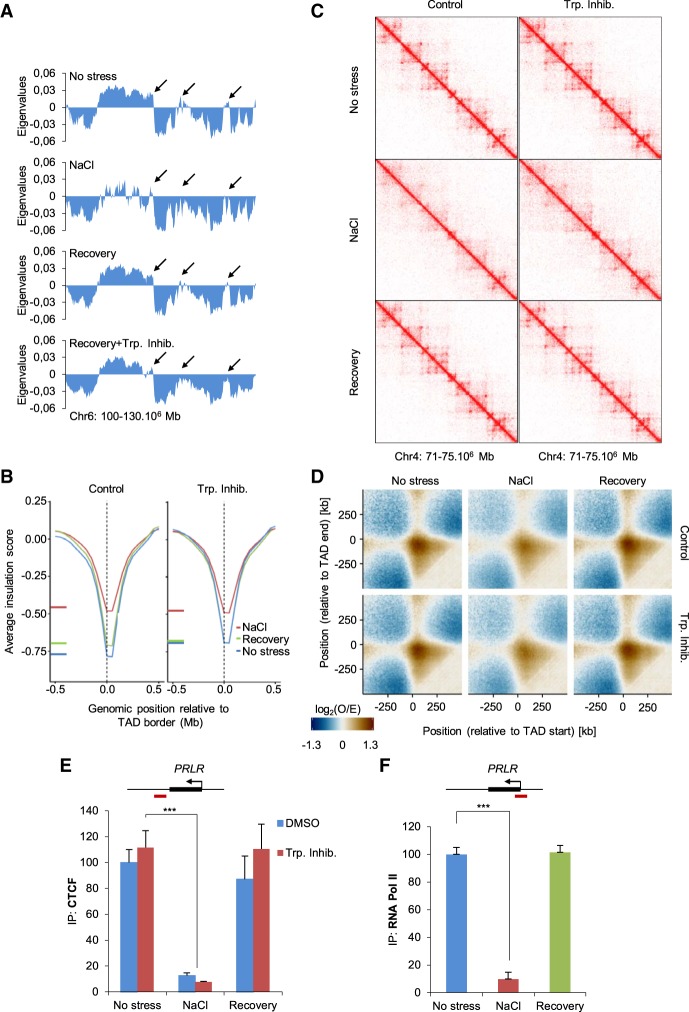
Figure 6.
Stress response is a dynamic reversible process. (A) Eigenvalues from a region of Chromosome 6 under the indicated conditions: NaCl 60 min, recovery (NaCl 60 min followed by isotonic 60 min). When indicated, the transcription inhibitor (Trp. Inhib.) triptolide (500 nM) was added prior to stress. Arrows indicate regions that do not fully recover following inhibition of transcription. (B) Insulation score under the indicated condition in a 1-Mb window surrounding TAD borders defined in the absence of stress (50-kb resolution). (C) Example of Hi-C interaction matrices from a region of Chromosome 4 (15-kb resolution) under the indicated conditions. (D) Aggregated contact profiles centered on TAD borders representing the loss and recovery of interactions between both ends of TADs, both with and without triptolide. Data are presented as the log2 ratio of observed and expected contacts in 10-kb bins. (E) CTCF binding at the indicated CTCF binding site; red box indicates amplified region in the qPCR, as analyzed using qPCR in control, NaCl, and recovery samples (SEM of N = 3). (***) P < 0.005; Student's t-test. (F) Pol II binding at the PRLR TSS (red box indicates amplified region in the qPCR) was analyzed using ChIP-qPCR in control, NaCl, or recovery samples (SEM of N = 3). (***) P < 0.0001; Student's t-test.

