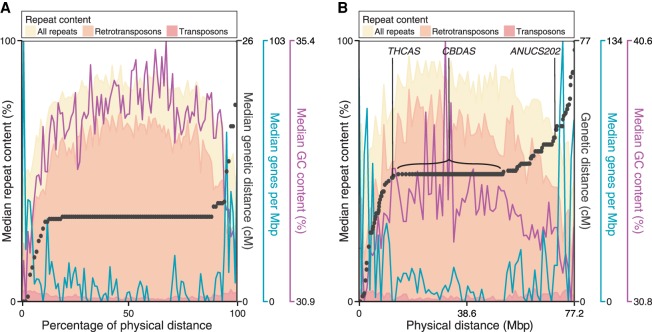
Figure 1.
Comparison of physical and genetic distance in Cannabis sativa and arrangement of sequence features on chromosomes. (A) Median values are indicated for all metacentric linkage groups (Chromosomes 5, 9, and 10 are excluded), scaled to the same physical length. Black points indicate the median increase in genetic distance every 1/100th of the physical distance. Shaded histograms superimposed show density of repeat sequences. Density of genes and GC content are also indicated by blue and purple lines. (B) Values for Chromosome 6, which contains the THCAS/CBDAS loci; here, black points are the representative of individual scaffolds.

