Figure 2.
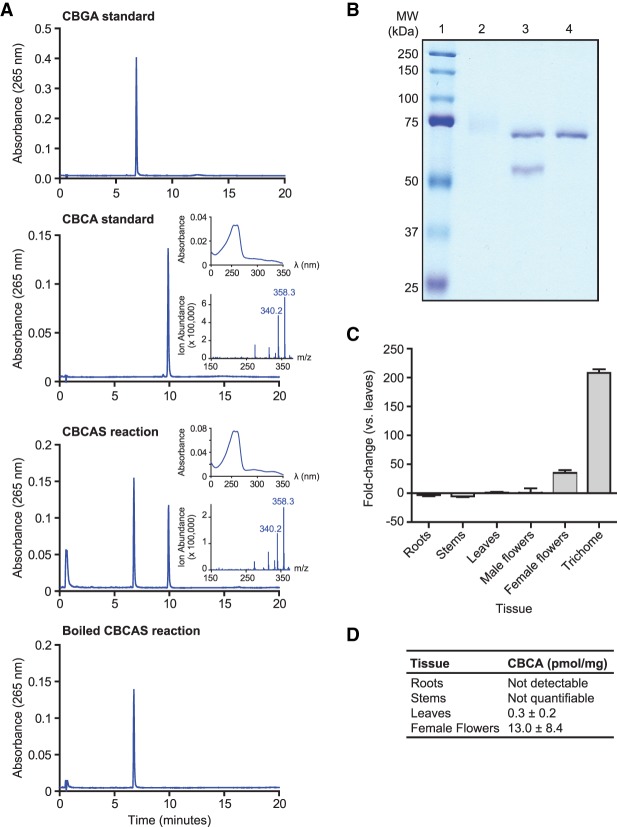
Characterization of CBCAS activity and expression. (A) HPLC analysis of CBCAS activity detected in Pichia pastoris cell cultures. Chromatograms of the CBGA substrate and CBCA standards are shown together with chromatograms of the enzyme reaction in media sampled from Pichia expressing CBCA in the presence of CBGA substrate before and after boiling at 95°C for 10 min. Insets correspond to the UV-absorbance spectrum (top) and the mass spectrum derived from a single quadrapole mass spectrometer (bottom) of the compound that eluted at 10 min. (B) SDS-PAGE analysis of CBCAS expressed in P. pastoris and purified by protein chromatography. (Lane 1) Protein ladder. (2) Concentrated protein fraction exhibiting CBCAS activity. The high-molecular-weight smear is glycosylated CBCAS. (3) Same fraction as lane 2, treated with EndoHf (MW = 70 kDa). (4) EndoHf only. (C) qRT-PCR analysis of CBCAS expression in cannabis tissues. cDNA derived from cannabis tissues was used as a template for PCR reactions using CBCAS-specific primers and EF1α as a reference gene. Differential expression of CBCAS is depicted as fold-change between tissue types compared with leaves. Trichome tissue consisted of isolated trichome secretory cells. (D) Quantification of CBCA content of the developing seedlings by HPLC.

