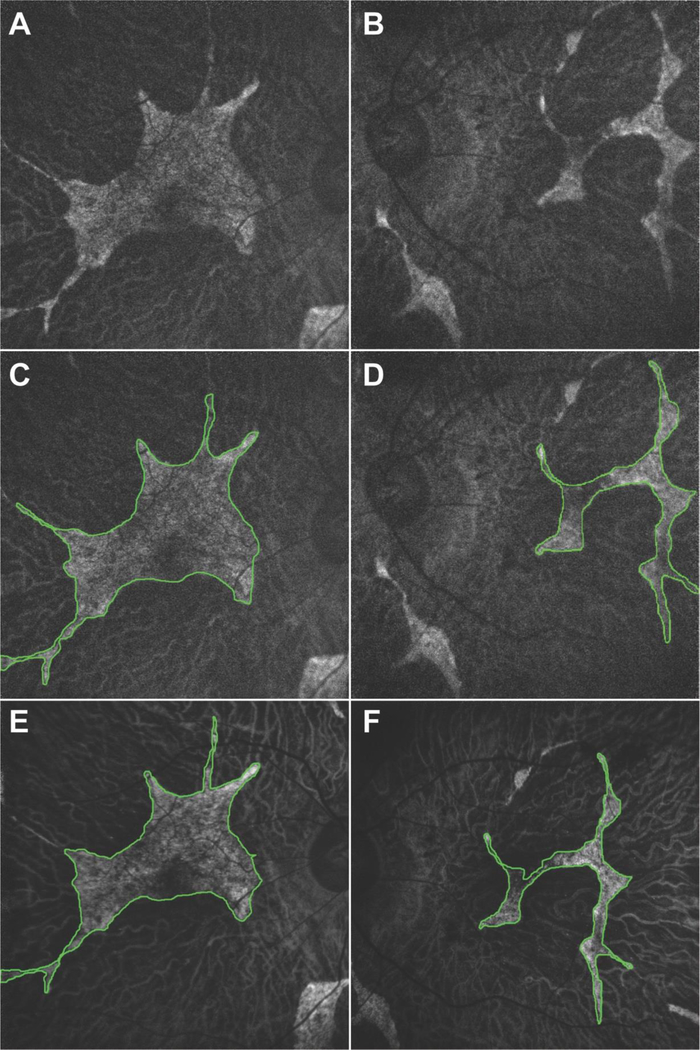
Figure 3.
Fundus autofluorescence imaging of the right (A, C, E) and left (B, D, F) eye showed generalized hypoautofluorescent areas corresponding to RPE atrophy bound by sharply demarcated borders. Areas of preserved retinal tissue were also detected on the parafoveal areas of both eyes (outlined in green). The area of preserved retinal tissue decreased in size from the first visit (A, B, C, D) to the second (E, F) visit by 17% in the right and 21% in the left eye.

