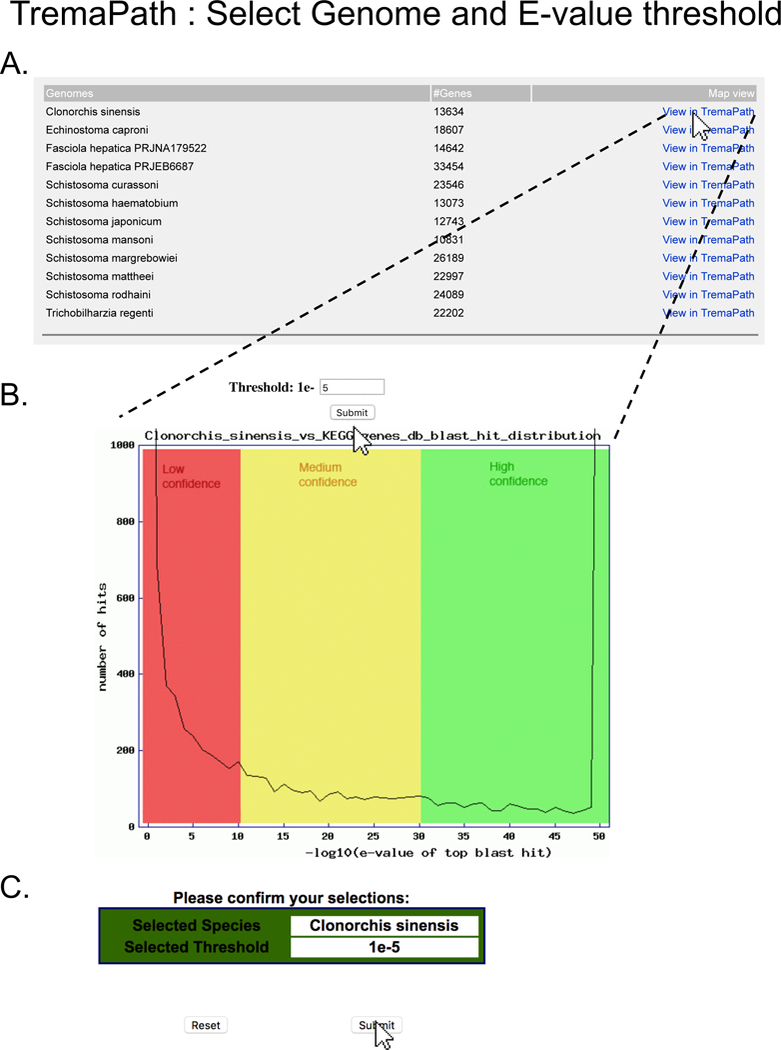
Figure 9. Selecting genome and annotation threshold for TremaPath usage.

On the main TremaPath page, clicking on the “Species-specific TremaPath comparisons” link takes the user to a page (A) where the user can select the species and assembly of interest. Clicking on “View in TremaPath” link leads to a page (B) that shows the distribution of KOs assigned at different E-value thresholds, with colors distinguishing low, medium and high confidence annotation. The user can indicate the E-value threshold they want by filling in the exponent and clicking the Submit button and confirming their input at the next page (C).
