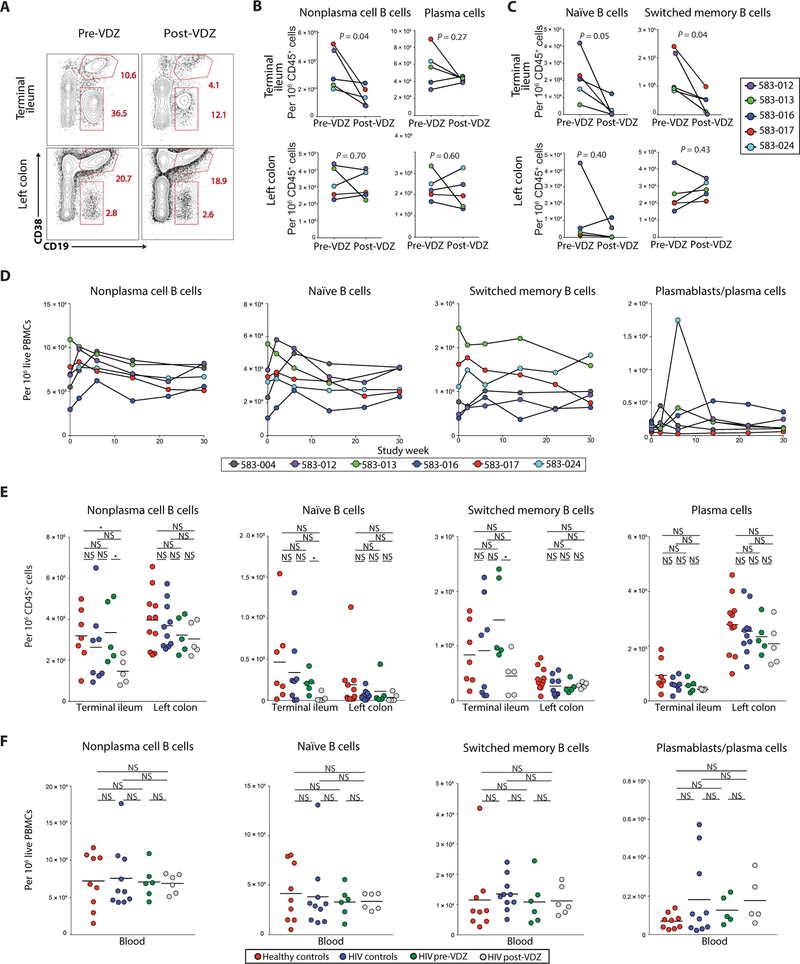
Fig. 1. Anti-α4β7 therapy decreases the frequency of B cell subsets in the TI.
(A to C) Frequency of B cells and plasma cells in the GI tract before and after VDZ therapy. (A) Representative flow cytometry plots showing the expression of CD19 and CD38 among live, CD45+ cells derived from the TI (top panels) and LC (bottom panels) of subject 583–017, before VDZ and at week 30 after VDZ. (B) Plots comparing the change in frequency of nonplasma cell (CD19+CD38−) B cells and plasma cells (CD45+CD38++CD27+) in the TI (top) and LC (bottom) between before and after VDZ treatment. (C) Plots demonstrating changes in the frequency of naïve (CD45+CD19+CD10−CD38−IgM+IgD+) and SM B cells (CD45+CD19+CD10−CD38−IgM−IgD−) in TI (top) and LC (bottom). (D) Change in the frequency of nonplasma cell B cells, B cell subsets, and plasma cells in the blood after VDZ therapy. In (A) to (D), each of the patients is represented with a unique color code. (E) Group comparisons in the frequency of B cell subsets and plasma cells within the TI and the LC. (F) Group comparisons in the frequency of B cell subsets and plasma cells in the peripheral blood. In (E) and (F), healthy volunteers (n = 11) are shown in red, HIV controls (n = 10) in blue, HIV-IBD subjects (n = 5) before VDZ in green, and HIV-IBD subjects after VDZ in gray. Two-tailed t test was performed to compare the different groups, and two-tailed paired t test was used to compare pre- and post-VDZ time points in the HIV-IBD patients. Statistical values are as indicated. *P < 0.05. NS, not significant.

