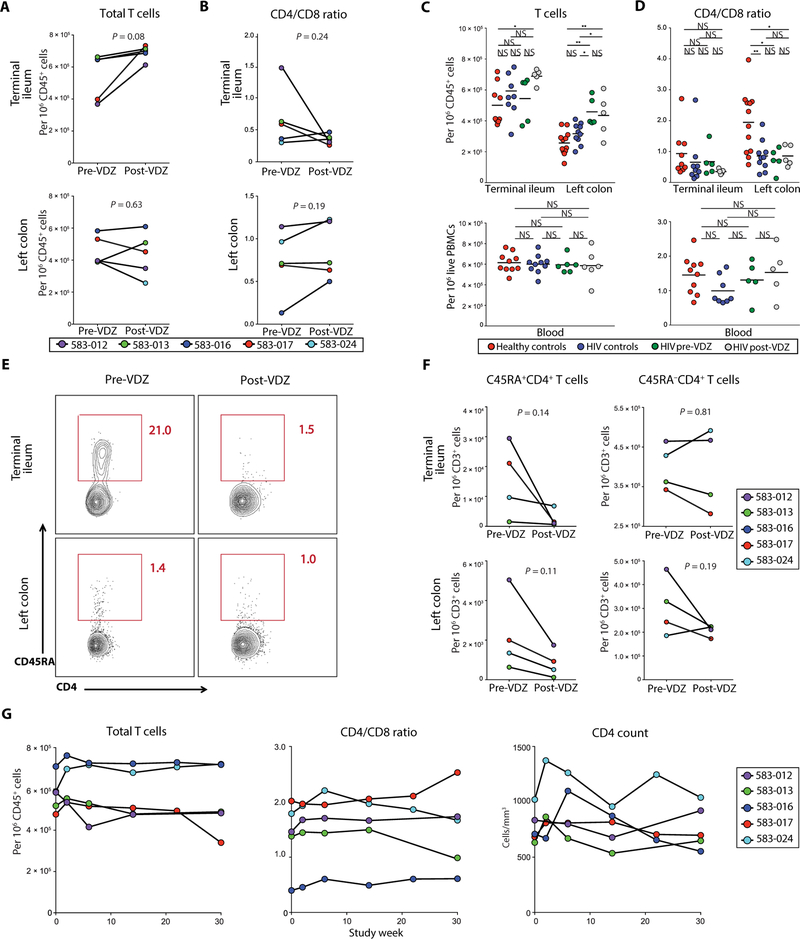
Fig. 3. Anti-α4β7 therapy results in a decrease in naïve CD4+ T cells in the TI.
(A and B) Frequency of T cells in the GI tract before and after VDZ therapy. (A) Frequency of total CD3+ T cells and (B) CD4/CD8 T cell ratio in the TI (top panels) and LC (bottom panels). Each of the patients is represented with a unique color code, and statistical values are indicated. (C and D) Group comparisons between the frequency of T cells (C) and CD4/CD8 ratio (D) in the GI tract (top panels) and peripheral blood (bottom panels). Healthy volunteers (n = 12) are shown in red, HIV alone controls (n = 10) in blue, HIV-IBD subjects before VDZ (n = 5) in green, and HIV-IBD subjects after VDZ (n = 5) in gray. (E and F) Frequency of naïve and memory CD4+ T cells in the GI tract before and after VDZ. (E) Representative flow cytometry plots showing the expression of CD45RA on CD45+CD3+CD4+ T cells derived from the TI (top panels) and LC (bottom panels) of subject 583–024 before VDZ and at week 26 after VDZ. (F) Cumulative data showing changes in CD45RA+ (left) and CD45RA−CD4+ T cell subsets (right) within the TI (top panels) and LC (bottom panels). Notably, CD45RA+ staining on CD4+ T cells was available on four of five patients. (G) Cumulative data showing changes in the frequency of circulating total CD3+ T cells, CD4/CD8 ratio, and total CD4+ T cells during VDZ therapy for each patient. In (F) and (G), each of the patients is represented with a unique color code, and statistical values are indicated. *P < 0.05, **P < 0.005. Two-tailed t test was performed to compare the different groups, and two-tailed paired t test was used to compare pre- and post-VDZ time points in the HIV-IBD patients.

