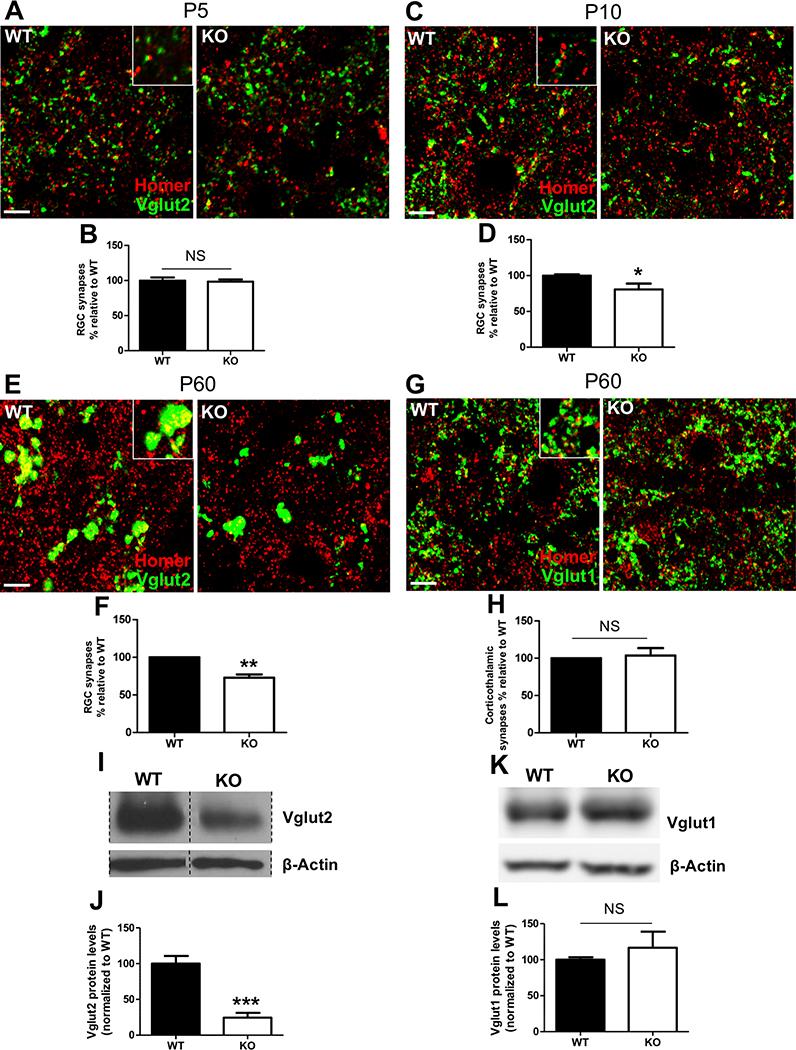
Figure 3. CD47KO Mice Have Reduced Numbers of Vglut2-Positive Retinogeniculate Synapses.
(A) Representative 63× confocal image depicting synaptic staining for retinogeniculate presynaptic marker Vglut2 (green) and postsynaptic marker Homer1 (red) in P5 WT (left) and CD47KO (right) mouse dLGN. Scale bars, 5 μm.
(B) Graph depicting the percentage of retinogeniculate (RGC) synapses in P5 CD47KO mice relative to that seen in WT littermate controls, n = 5 WT and 6 CD47KO mice. Not significant (NS), unpaired t test.
(C) Representative 63× confocal images of synaptic staining for retinogeniculate presynaptic marker Vglut2 (green) and postsynaptic marker Homer1 (red) in P10 WT (left) and CD47KO (right) dLGN. Scale bars, 5 μm.
(D) Graph depicting the percentage of RGC synapses in P10 CD47KO mice relative to that seen in WT littermate controls, n = 6 WT and 5 CD47KO mice. ∗p < 0.04, unpaired t test. Unlike at P5, P10 CD47KOs have significantly reduced numbers of RGC synapses.
(E) Representative 63× confocal images of synaptic staining for Vglut2 (green) and Homer1 (red) in P60 WT (left) and CD47KO (right) dLGN. Scale bars, 5 μm.
(F) Graph depicting the percentage of RGC synapses in P60 CD47KO mice relative to that seen in WT littermate controls, n = 5 WT and 5 CD47KO mice. ∗∗p < 0.01, one-sample t test. P60 CD47KOs have a sustained reduction in RGC numbers.
(G) Representative 63× confocal images of synaptic staining for corticogeniculate presynaptic marker Vglut1 (green) and postsynaptic marker Homer1 (red) in P60 WT (left) and CD47KO (right) dLGN. Scale bars, 5 μm.
(H) Graph depicting the percentage of corticogeniculate synapses in P60 CD47KO mice relative to that seen in WT littermate controls, n = 4 WT and 4 CD47KO mice. NS, one-sample t test.
(I) Representative western blot image of Vglut2 in microdissected dLGN from P60 WT and CD47KO littermates (lanes containing other samples, indicated by hashed lines, removed for clarity).
(J) Quantification of western blot in (I) shows Vglut2 levels are significantly reduced in the P60 CD47KO dLGN, n = 5 WT and 4 CD47KO mice. ∗∗∗p < 0.001, unpaired t test.
(K) Representative western blot image of Vglut1 in microdissected dLGN from P60 WT and CD47KO littermates.
(L) Quantification of western blot in (K) indicates that Vglut1 levels are unchanged in the mature CD47KO dLGN, n = 7 WT and 6 CD47 mice. NS, unpaired t test. All error bars represent SEM.

