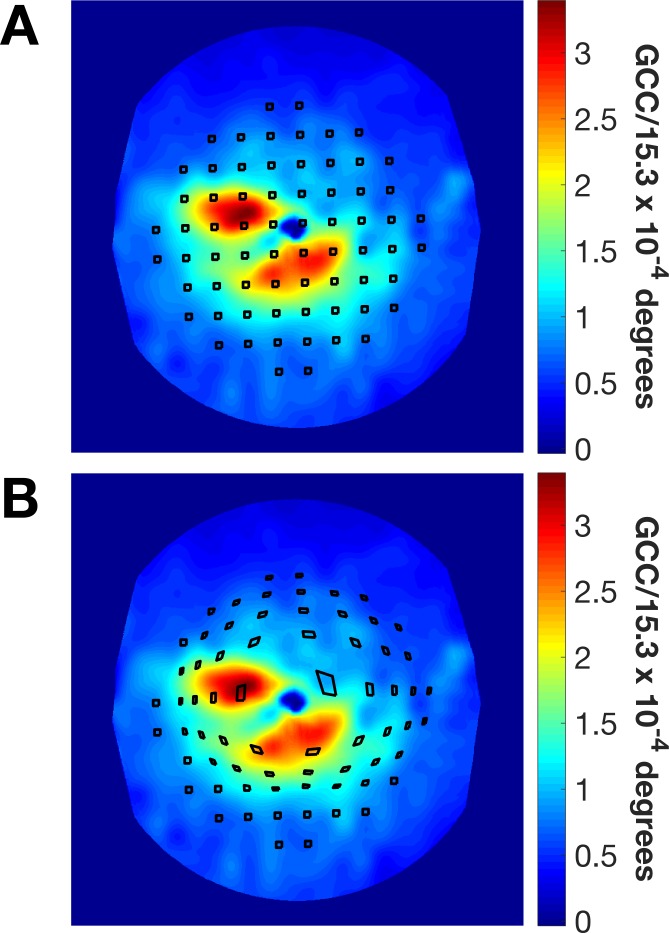
Figure 2.
Quantification of the local macular damage. (A) Exemplar estimated GCC map derived from the segmented GCL in a macular OCT scan. The black squared regions are centered on each one of the 68 locations in the 10-2 grid and have the same area as a G-III stimulus. (B) The same regions displaced and distorted using the model proposed by Drasdo et al.26 The anisotropic distortion is a consequence of the shift of the grid center from the anatomical fovea.

