
Figure 5.
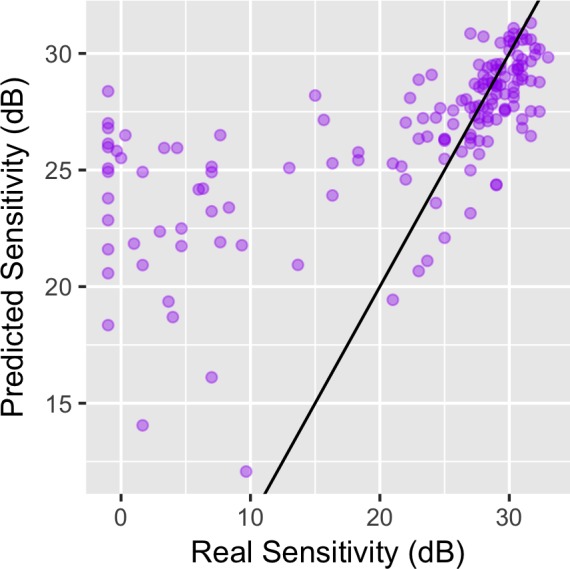
Accuracy of predictions of the 50% thresholds from the structure-function model for subjects in group 2. On the horizontal axis, the real threshold values estimated by averaging three perimetric tests. On the vertical axis, the prediction from the structure-function model. The purple dots represent each single location, while the black line represents the ideal perfect equivalence. Due to the bottom floor effect, the thresholds are largely overestimated below 20 dB.