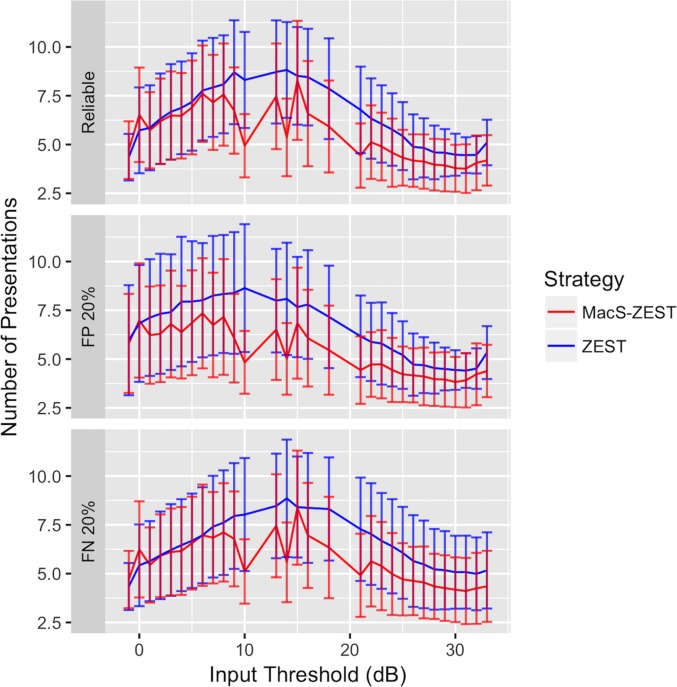
Figure 7.
Average number of presentations per location (solid line) at different sensitivities with simulated reliable responses (top panels), 20% FP errors (middle panel), and 20% FN errors (bottom panel) for the MacS-ZEST (red) and the ZEST (green). The graphs report the number of presentations (vertical axis) at different input thresholds (horizontal axis). The vertical bars represent the SDs at each simulated input threshold. A reduction in presentations was obtained for thresholds higher than 10 dB.

