Figure 7.
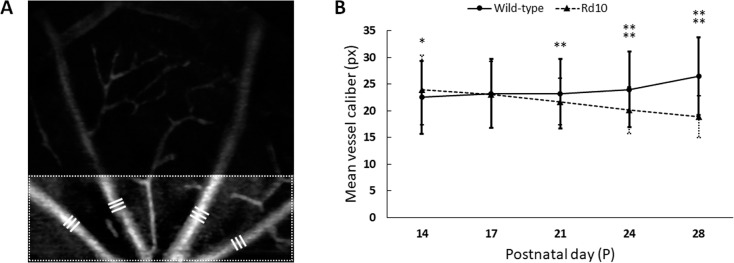
Quantitative measurement of blood vessel caliber. (A) Mean calibers of the first-order blood vessel branches in the SVP were measured. The measurement area was confined to the lower end (one-third part of the SVP image), and triple times measurements (white bars) were made per each branch. (B) With aging, mean vessel caliber increased in WT (22.5 ± 6.83 pixels at P14 to 26.5 ± 7.29 pixels at P28), while it decreased in rd10 (23.9 ± 6.52 pixels at P14 to 18.9 ± 3.93 pixels at P28). N = 13 for WT and N = 16 for rd10. P values for pairwise comparisons between WT and rd10 are indicated by asterisks: *P < 0.05; **P < 0.01; ***P < 0.001; ****P < 0.0001.

