Fig. 3.
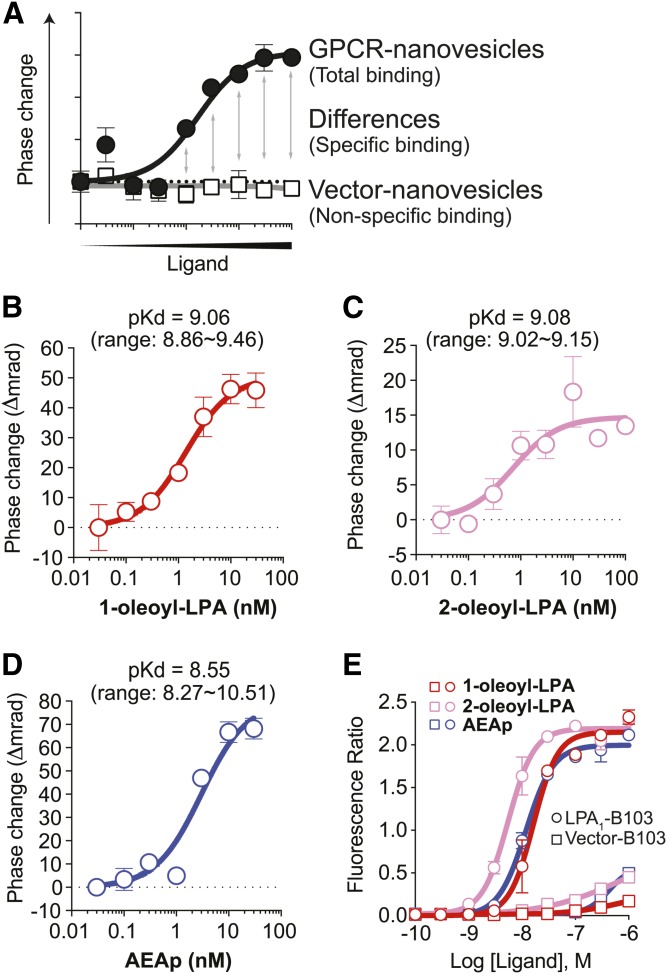
BSI determines binding affinities between endogenous LPA1 ligands versus LPA1. A: An example of binding curves of nonspecific and total binding. Specific binding is calculated by subtracting nonspecific binding from total binding. B–D: Specific-binding curves between LPA1 versus 1-oleoyl-LPA (B), 2-oleoyl-LPA (C), and AEAp (D). Mean ± SEM. n = 5. pKd values were shown as mean with a range from two (B, Kd = 0.87 ± 0.37 nM; and C, Kd = 0.83 ± 0.09 nM) and three (D, Kd = 2.80 ± 0.89 nM) independent experiments. E: Ca2+ mobilization in LPA1-B103 and Vector-B103 cells. Cells were loaded with Fluo-4, and the intracellular Ca2+ mobilization response to the indicated ligands was monitored with a Hamamatsu FDSS7000. Mean ± SEM. n = 2. A result from two independent experiments with similar results is shown.

