Fig. 1.
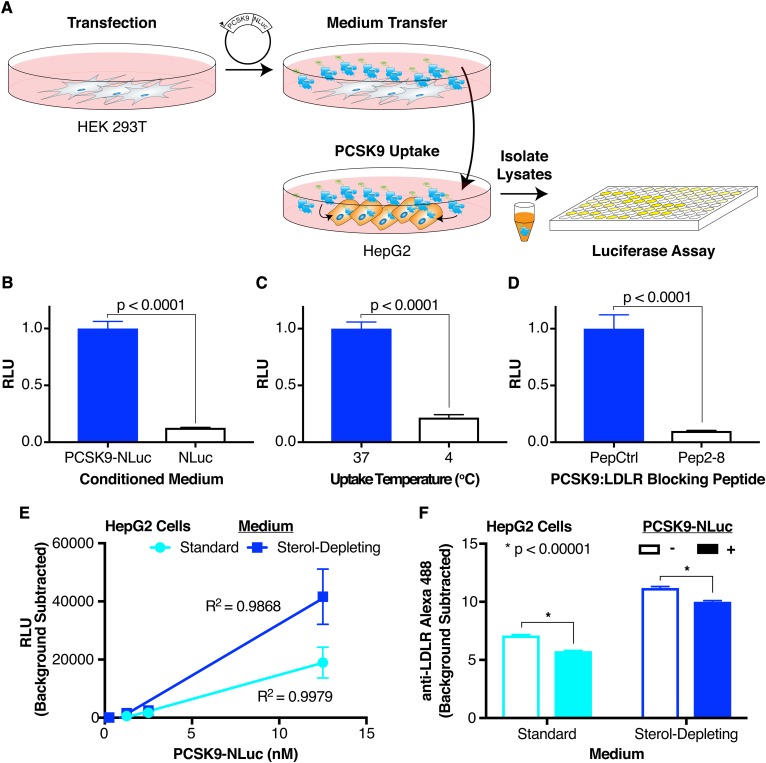
Luciferase-based assay for PCSK9 uptake. A: Overall schematic of assay. A PCSK9-NLuc fusion is heterologously expressed in HEK 293T cells, and the conditioned medium then transferred to HepG2 cells. Cell lysates are collected after the exogenous PCSK9-NLuc is taken up into cells, with the amount internalized quantified by luminescence. B: Relative luminescence of HepG2 cell lysates treated with PCSK9-NLuc (12.5 nM, blue bar) or an equivalent amount of free NLuc (open bar). Values are normalized to 1 for the PCSK9-NLuc treatment. C: Relative luminescence of HepG2 cell lysates treated with PCSK9-NLuc (12.5 nM) at an incubation temperature of 37°C (blue bar) or 4°C (open bar). Values are normalized to 1 for the 37°C condition. D: Relative luminescence of HepG2 cell lysates treated with PCSK9-NLuc (12.5 nM) and coincubated with an inactive peptide control (PepCtrl, blue bar) or a PCSK9:LDLR blocking peptide (Pep2-8, open bar). Values are normalized to 1 for the inactive peptide control. E: Luminescence, corrected for assay background, of equivalent amounts of HepG2 cell lysates treated with increasing concentrations of PCSK9-NLuc, stratified by the presence (blue) or absence (cyan) of sterol-starvation. Data include three separate experiments without normalization. Linear regression lines with the appropriate goodness-of-fit (R2) values are shown. F: Alexa Fluor 488 fluorescence, as a proxy for cell surface LDLR expression, and as determined by flow cytometric analysis, of HepG2 cells treated for 4 h with (filled bars) or without (open bars) PCSK9-NLuc and stratified by the presence (blue) or absence (cyan) of sterol-starvation.

