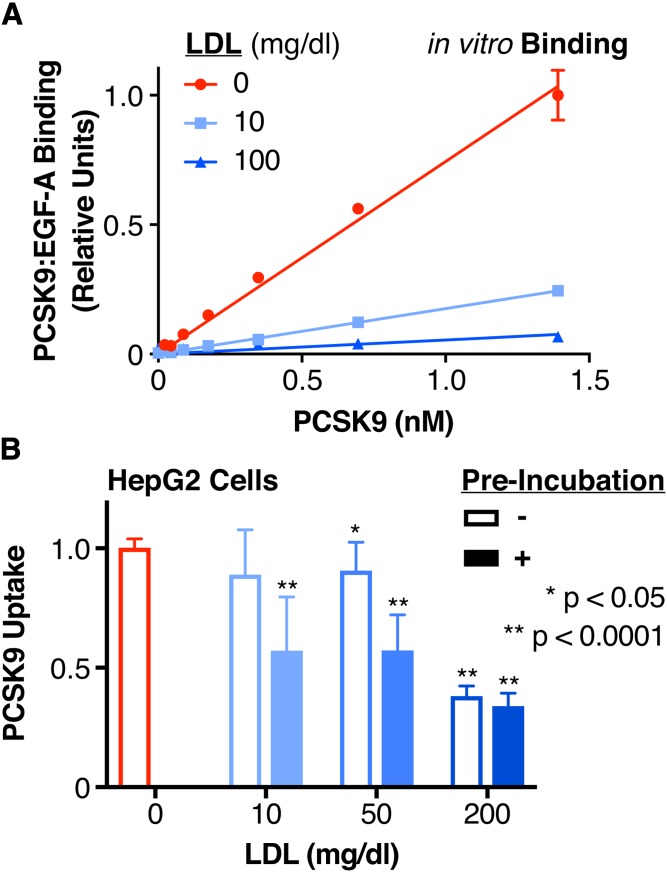
Fig. 2.
Effect of LDL on the PCSK9:LDLR interaction and PCSK9 uptake. A: Relative binding of increasing concentrations of PCSK9 to the EGF-A domain of LDLR in the absence (red) or presence of subphysiologic (10 mg/dl, cyan) or physiologic (100 mg/dl, blue) LDL, as measured by a commercially available PCSK9-LDLR ELISA assay. Raw absorbance data are normalized to 1 for the highest PCSK9 concentration in the absence of LDL and 0 in the absence of PCSK9. The linear regression lines are shown, with the extra-sum-of-squares F test indicating different slopes at P < 0.0001. B: Relative uptake, as measured by luminescence assay, of PCSK9-NLuc by HepG2 cells in the presence of increasing concentrations of LDL, shown by sequential addition (open bars) or preincubation (filled bars) of PCSK9 with LDL. Raw luminescence data are normalized to 1 for PCSK9-NLuc treatment in the absence of LDL and 0 in the absence of PCSK9-NLuc uptake. P values indicate comparison to the control (no LDL, red) arm.

