Fig. 7.
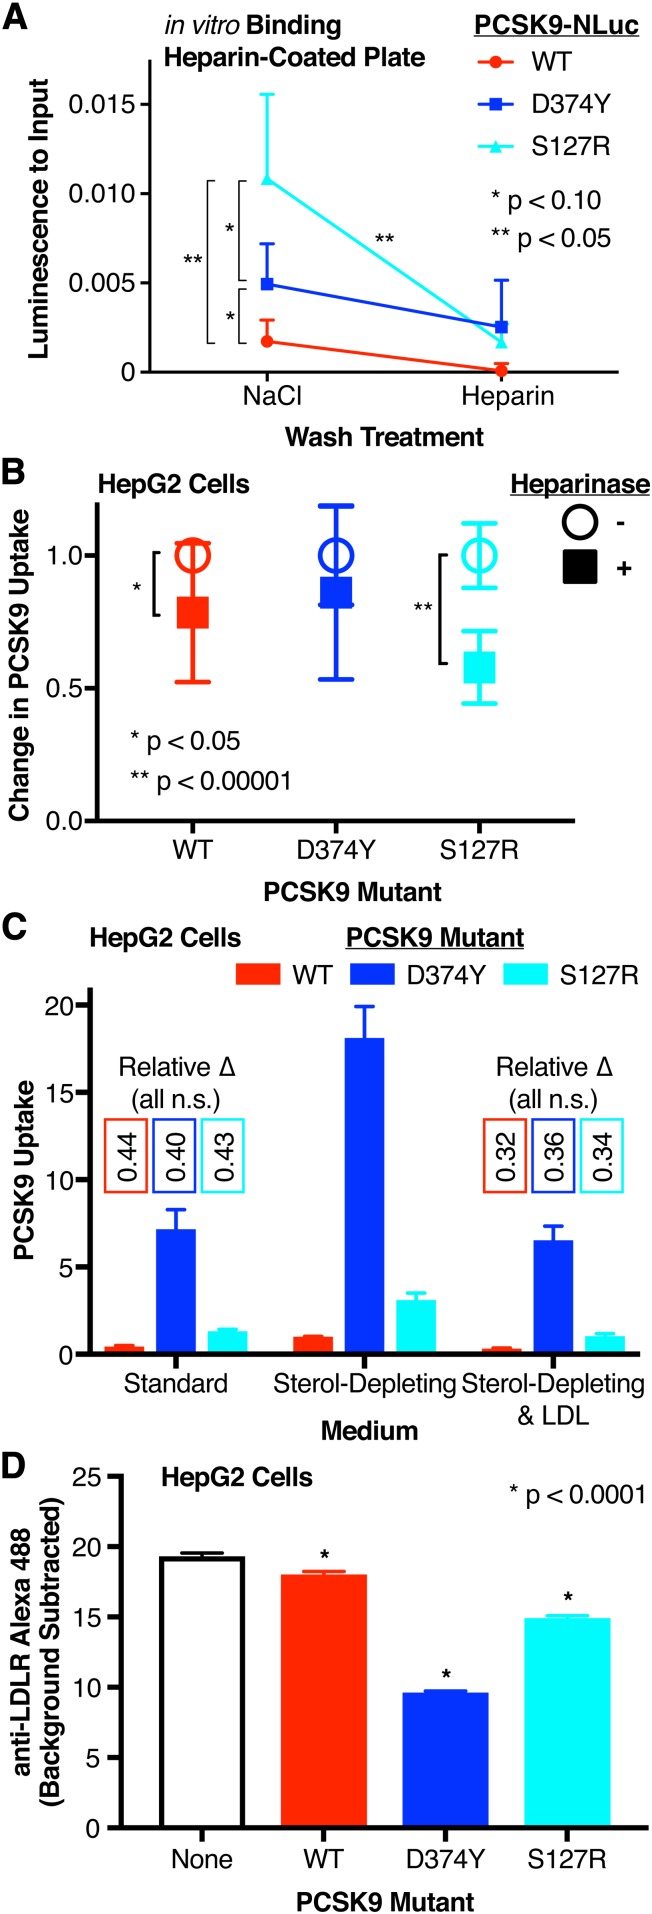
Effect of PCSK9 GOF variants on heparin binding and PCSK9 uptake. A: Relative in vitro binding affinity of WT (red), D374Y (blue), and S127R (cyan) PCSK9-NLuc to heparin after high-salt and heparin competition washes, as measured by luminescence assay. The Y axis shows relative luminescence compared with initial input on the heparin-coated plate. Only one side of each set of error bars is shown for clarity. B: Relative PCSK9 uptake, as measured by luminescence assay, by untreated (open circles) and heparinase-treated (filled squares) HepG2 cells incubated with WT (red), D374Y (blue), or S127R (cyan) PCSK9-NLuc-conditioned medium. Luminescence data are normalized to 1 for each PCSK9-NLuc treatment and 0 in the absence of PCSK9-NLuc treatment. C: Relative uptake, as measured by luminescence assay, of WT (red), D374Y (blue), or S127R (cyan) PCSK9-NLuc by HepG2 cells, stratified by sterol-starvation or LDL (200 mg/dl) coincubation. Luminescence data are normalized to 1 for WT PCSK9-NLuc treatment of sterol-starved cells and 0 in the absence of PCSK9-NLuc treatment. Numbers showing the relative change for each variant (compared with the uptake of that variant for sterol-starved cells) are listed. D: Alexa Fluor 488 fluorescence, as a proxy for cell surface LDLR expression, and as determined by flow cytometric analysis, of HepG2 cells treated in the absence (black) or presence of WT (red), D374Y (blue), or S127R (cyan) PCSK9-NLuc.

