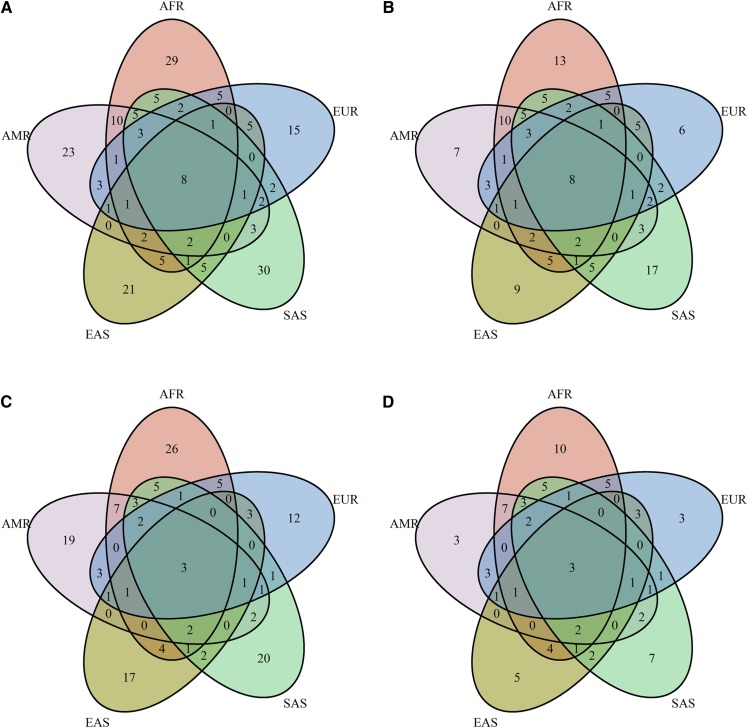
Fig. 4.
Venn diagrams for the exonic KIV-2 variation in 1000 Genomes. Venn diagram showing (on an amino acid level) the overlap of unique coding (A, B) and unique missense variants (C, D) observed in the different super populations of the 1000 Genomes exome data set. Panels A and C show all variants, while panels B and D are restricted to variants observed at least twice. A consistent portion of variants is exclusive to single populations. Variants according to supplemental Table S11. The figure based on the DNA level is shown in supplemental Fig. S13. AFR, African; AMR, Admixed American; EAS, East Asian; EUR, European; SAS, South Asian.

