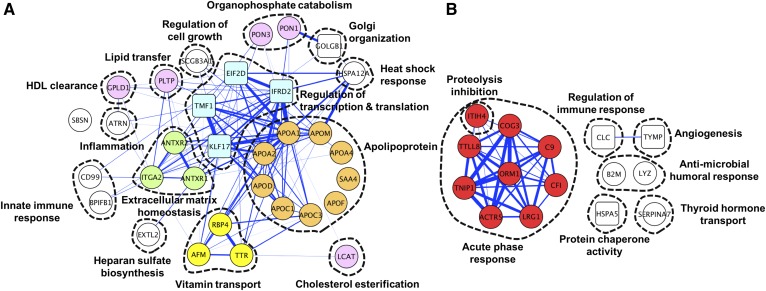
Fig. 1.
Correlations among plasma proteins positively correlated (A) and negatively correlated (B) with plasma HDL-C concentrations (q < 0.05 and n > 100) in children of rural Nepal aged 6–8 years. The thickness of the lines reflects the strength of positive correlation coefficients between proteins (r ≥ 0.3 are presented). Circles and squares represent individual extracellular and intracellular proteins, respectively, indicated as their HUGO gene symbols. Dashed lines indicate molecular or functional clusters. Proteins with colors are mentioned in the text.

