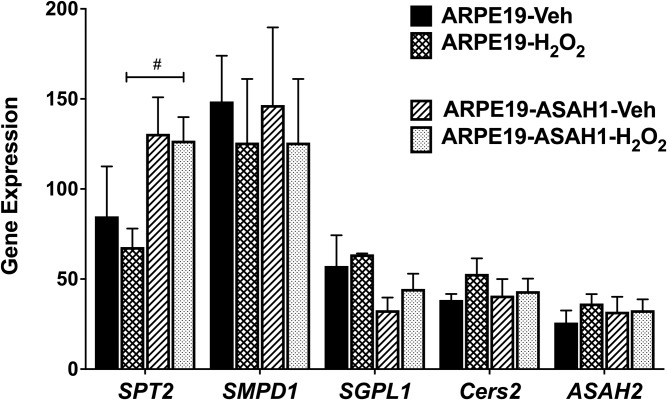
Fig. 7.
RT-PCR analysis of sphingolipid metabolic genes with oxidative stress. Each sample included in a condition that consisted of three independent RT-PCR experiments that were averaged and normalized against housekeeping genes. Bar graphs are represented as mean ± SEM. Change in sphingolipid genes as a result of overexpressed ASAH1 and stress condition. Significant difference between cell types depicted: #P < 0.05; n = 4. SMPD1, SM phosphodiesterase 1; SGPL1, S1P lyase 1; Cers2, Cer synthase 2.

