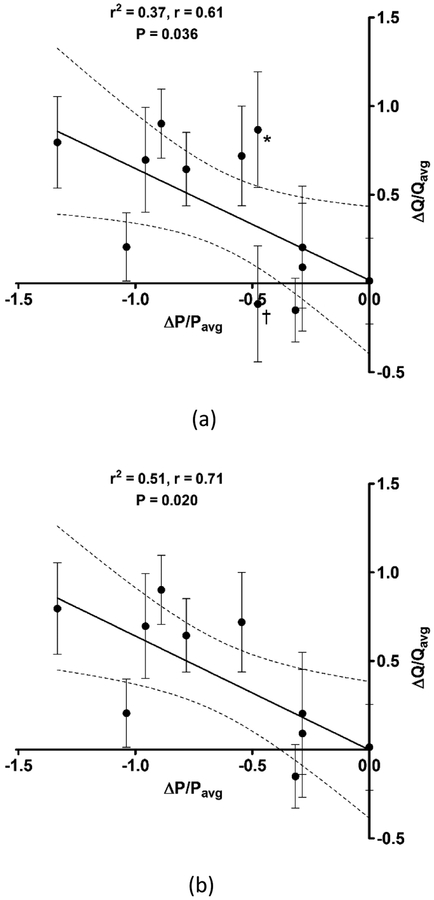
Figure 4:
Relationship between mean-normalized change in pre- and post-revision shunt volume flow (ΔQ/Qavg) and mean-normalized change in pre- and post-revision portosystemic pressure gradient (ΔP/Pavg) for (a) all transjugular intrahepatic portosystemic shunt (TIPS) cases for which a revision was performed and (b) excluding two revised TIPS cases (*,†) for reasons as described in the text. Solid line represents the linear regression and dashed lines represent 95% confidence intervals. Error bars indicate standard deviation in the flow metric for an up to 30-volume data set.

