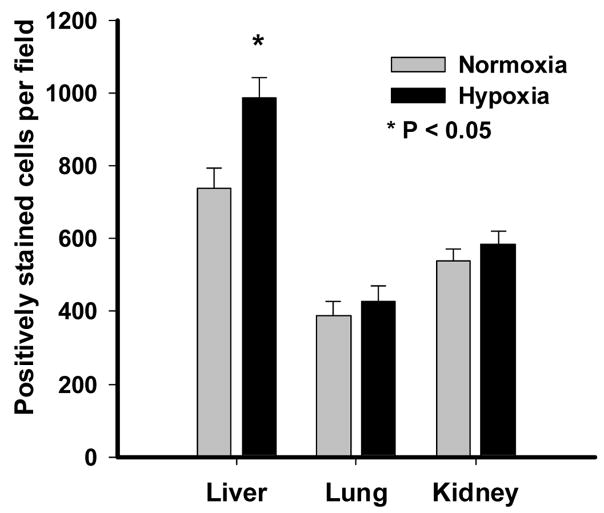
Figure 2.
Quantification of pimonidazole immunostaining. This shows the average number of positively stained cells counted from six fields per section using digital image analysis system at 200x magnification. Responses are mean ± SEM. Grey bar = normoxia (N=5) and Black bar = hypoxia (10.5%O2 for 14d, N=6)). * indicates P< 0.05.

