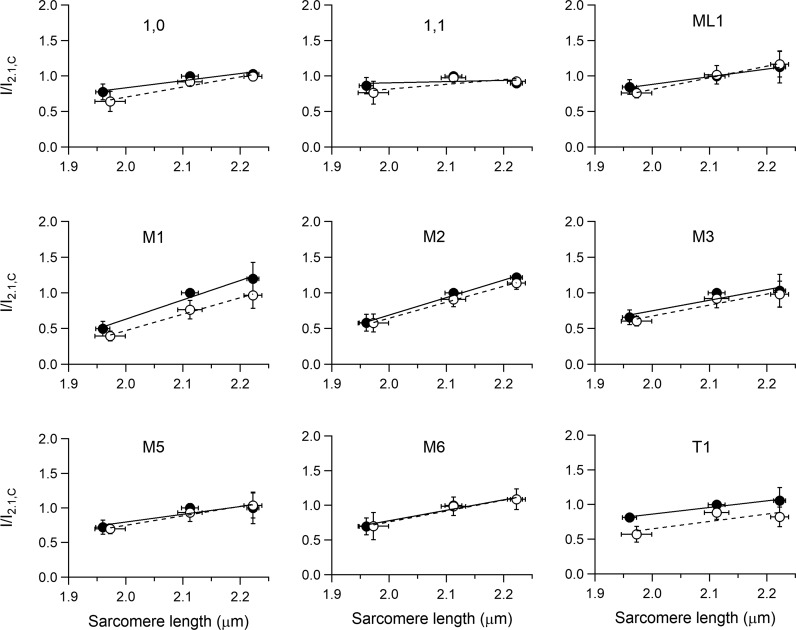
Figure 6.
SL dependence of the intensities of the 1,0 and 1,1, the myosin-based ML1 layer line and M1–M6 meridional, and the troponin-based T1 reflections. Intensities are relative to the intensity in control at SL 2.11 µm. Data, symbols, and lines as explained in Fig 5.

