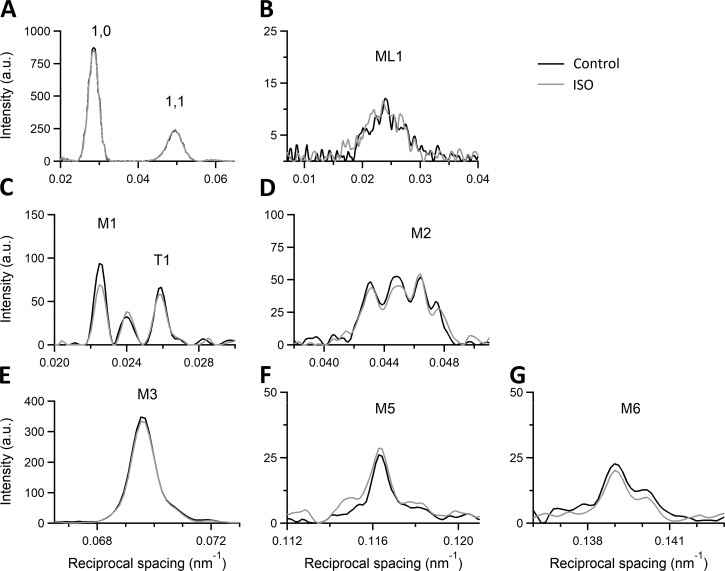
Figure 8.
Effect of ISO on the 1-D intensity distribution from x-ray diffraction patterns during the diastole. SL 2.11 µm; black (same trace as black in Fig. 4 ) control; gray, in the presence of 10−7 M ISO. (A) Intensity distribution along the equatorial axis with indicated low-angle I1,0 and I1,1. (B) Intensity distribution along the meridional direction of ML1. (C–G) Meridional intensity distribution of the analyzed myosin-based reflections from M1 to M6 and of the troponin-based T1 reflection. Camera length 1.6 m, total exposure time for each condition, 120 ms, summed from four trabeculae.

